http://blog.fortiusone.com/2008/05/24/using-mapshaper-to-create-smaller-shapefiles-and-kml-through-finder/
We’ve been doing a lot of data migration and new data uploads with Finder! and often times our data team runs into data and mapping headaches. One that we commonly encounter are largish shapefiles that make for really bloated KML when we convert it (for instance a 2mb shapefile for US counties becomes a 5.4 mb KML file). The end result are big files that completely kill browser based applications like Virtual Earth and Google Maps, or load really slowly in thick client applications like Google Earth and ESRI AGX.
There are three factors that constitute file bloat for any vector based geospatial data:
1) The number of attributes (how many columns)
2) The number of features (how many rows)
3) The complexity of the geometry (how much needs to be drawn)
You can do some clever things to manage the first two at a low level - although you still are going to have bloat when you convert to a standard file format. The third factor, geometry complexity, is interesting because you can also do some low level tricks whose savings can be passed along to standard file formats. Reducing the complexity of geometry is often called “map generalization” in academic circles.
tirsdag den 27. maj 2008
torsdag den 22. maj 2008
Google introduces Maps Flash API
http://code.google.com/apis/maps/documentation/flash/
This API lets Flex developers embed Google Maps in Flash applications. Similar to the JavaScript version, this ActionScript API provides a number of utilities for manipulating and adding content to maps through a variety of services, enabling you to embed robust, interactive maps applications on your website.
This API lets Flex developers embed Google Maps in Flash applications. Similar to the JavaScript version, this ActionScript API provides a number of utilities for manipulating and adding content to maps through a variety of services, enabling you to embed robust, interactive maps applications on your website.
Poly9 highlights FreeEarth
http://freeearth.poly9.com/
Poly9 FreeEarth is a cross-browser, cross-platform 3D globe which does not require any download. Give it a spin!
Poly9 FreeEarth is a cross-browser, cross-platform 3D globe which does not require any download. Give it a spin!
"Real time" 19th century data - and another sneak peek at 480
http://blogs.esri.com/Info/blogs/arcgisexplorerblog/archive/2008/05/21/real-time-19th-century-data.aspx
We're blessed with the availability of "real time" content these days, and recently blogged about the upcoming support for GeoRSS feeds in Explorer 480 as part of the landscape of timely information.
Another recent post on the GIS Education Community blog discusses what "real time" may have been like when the earth was still terra incognita using the Pinkerton 1812 map from the Explorer Resource Center.
Below is a screenshot showing the Pinkerton 1812 layer swiped to reveal a sneak peek at the new graticule support we'll be delivering with Explorer 480. This new user option allows your choice of graticule units and the ability to display reference grids such as the US National Grid and MGRS.
onsdag den 21. maj 2008
Det geospatiale web

ABSTRACT sendt til kortdage udvalget.
Hjemmesiden kommer til kort – internettet bliver GIS’et til.
Alt på ét sted, tingene ordnet og arrangeret som den enkelte finder det bedst, og bedst af alt det hele passer sig selv. Dette kunne være fremtiden for din egen personlige hjemmeside. Plugins, widgets, gadgets, rss feeds, applications udvalget er stort, når man som helt almindelig privat borger, får tilbudt at sammensætte sin helt egen gratis hjemmeside, og det sker lige så let, som da man sad som barn og samlede legoklodser. Flere og flere af de nye klodser er begynder at blive geo-orienterede med kort (og GIS) af den ene eller anden slags.I starten gjorde the world wide web information geografisk uafhængigt. Med få klik kunne man hente information fra hele verden uafhængig af tid og sted. Garneret med visuelle billeder og effekter gik internettet sin sejrsgang kloden rundt. De nye teknologier er dog ved at genskabe afhængigheden. Det geospatiale web er ved at tilbageføre geografien i informationerne og mangedobler værdien af denne ved den stedsfæstelse, som i årevis har været negligeret. Internettet er sprængfyldt med information, som på historisk kort tid er dukket op, som følge af en massiv global kollektiv instats. Med kort og GIS som den nye informationsplatform, har firmaer som Google og Microsoft vist at denne tendens vil fortsætte og forstærkes, givet den geografiske dimmension.
Den som kan fremstille de bedste byggeklodser baseret på kort og GIS vil være at finde på størsteparten af fremtidens personlige hjemmesider. Kommuner og stat bør være med, de bør optræde på enhver borgers hjemmeside som en naturlig integreret del. Den digitale forvaltning bør ske naturligt på borgernes egne præmisser med de værktøjer som de finder bedst.
Den næste generation venter …
Med udgangspunkt i KMDs data og GIS vil det blive forsøgt belyst hvorledes GIS kan komme udover den tekniske forvaltning, hvordan den kan havne hos den almindelige borger og endelig hvordan GIS’en kan styrkes og forbedres ved at lade den kollektive insats supplere det faglige fundament. De globale strømninger kan danne basen for de lokale krusninger – måden vi i dag tænker kort og GIS skal ikke længere være selvstændige isolerede løsninger, men fleksible enheder som kan samarbejde med andre ligesindede enheder, lokale såvel som globale, kommunale såvel som private.
Der vil formentligt blive vist en power point, live demoer og eksempler på kode – mash ups.
tirsdag den 20. maj 2008
ESRI and Google Offer New Solutions for Finding and Using ...
Podcast: ESRI and Google Offer New Solutions for Finding and Using ...
DirectionsMag.com - Glencoe,IL,USABy Joe Francica and Adena Schutzberg At last week's Where 2.0 conference held in Burlingame, California, Google's John Hanke and ESRI's Jack Dangermond ...
DirectionsMag.com - Glencoe,IL,USABy Joe Francica and Adena Schutzberg At last week's Where 2.0 conference held in Burlingame, California, Google's John Hanke and ESRI's Jack Dangermond ...
Google Health Launched
http://blogoscoped.com/archive/2008-05-19-n87.html
Google Health launched
The Google Health site once you’re signed in.
Google Health was put live early on, but only mentioned officially by Marissa Mayer later on during the talks. According to Google, with their new free service you can collect and manage your medical records and health information by building an online profile, and educate yourself about health issues. Google notes the service is currently English and US only (and for users age 18+), though you can access the interface from other countries too.
søndag den 18. maj 2008
Google Earth + ArcGIS - ArcGIS plugs-in support for the Geoweb
http://www.tmesolutions.co.uk/web_design_kent/Marketing+News/2008-05-18/Google+Earth+++ArcGIS+-+ArcGIS+plugs-in+support+for+the+Geoweb/3901992640
At Where2.0 this week many of the 'GISers' were wondering why ESRI seemed to only have a 5 minute spot scheduled on the stage - of interest though was that Jack was there on Monday taking in the show. Sure enough, during John Hanke's
CMS, eCommerce and Web Design White Papers RSS Feed
Ecommerce News RSS Feed
Online Marketing News RSS Feed
Internet News RSS Feed
Accessibility News RSS Feed
lørdag den 17. maj 2008
'Scraping'the web for geo-information
http://sdi-ea.blogspot.com/2008/05/scrapingthe-web-for-geo-information.html
By now most of us will have seen the joint ESRI/Google announcements at Where 2.0 about the upcoming ability to use Google Earth and Google Maps to discover, locate and portray geo-data hosted in ESRI ver 9.3 geo-server stacks to be released later this year.
In the interest of balance (and with no desire to provoke any flame wars) I draw your attention to another announcement at Where 2.0 addressing Geoserver's upcoming 1.7.0 release with similar capability - see http://blog.geoserver.org/2008/05/13/geoserver-and-googles-geo-search/
The point here is not about commercial versus free versus proprietary versus open source software. It's about two other more important things.
First: the maturation and acceptance of standards. Google has embraced the OGC specifications process and KML is now an anointed OGC standard; ESRI has embraced the OGC specifications standard and is positioning its products appropriately (e.g. ver 9.3 will also provide a fully-compliant web feature service as well as full support for PostgreSQL/PostGIS back-ends). The more this momentum build the more of this joined-up capability we'll all benefit from.
Second: the maturation and acceptance of visualization tools for non-specialists. If the Google/ESRI announcement had happened 5 years ago there'd have been barely a ripple outside the hard-core GIS community. The fact that The Rest of Us can now contemplate being able to publish geo-information (whether social and community based, conservation-related or whatever) --and-- have it discovered, integrated, employed and appreciated by non-specialists audiences via attractive spinny-globe-type-products is a powerful combination.
What is crucial here, and to me will make or break this effort, is the ready availability of easy-to-use tools to take my existing geo-data and get it into a search-able, discover-able, use-able form without having to have a masters degree and without having to learn to speak techno-babble. And that is equally true whether 'I' am individual Mick Wilson or whether 'I' am a multi-national conglomerate.
We need to keep lowering the bar to the publishing of real-world data about real-world events by real-world-people.
fredag den 16. maj 2008
The ESRI-Google Where 2.0 Announcement
Several geoblogs mentioned the Google ESRI joint keynote at Where 2.0, and All Points Blog elaborates on what it may mean for the near and far future.
From their conclusions: "These announcements have some important implications for the geospatial marketplace:
- the use of and demand for ArcGIS Server should rise.
- any geo data or services provider who wants to play on the Web needs to look at how it will provide findability and usability of its data and services in this way.
- geodata-finding portals may, in time, become extinct - if the KML vision for search and distribution becomes a de facto one as well.
- the technology may be available, but the institutional barriers to data sharing may still be blocking the path (as noted in a question at the end of the session)."
Also interesting is the GeoServer 1.7.0 plan to be automatically crawlable by Google’s geosearch.
Timely information via GeoRSS - Sneak peek at Explorer 480
http://blogs.esri.com/Info/blogs/arcgisexplorerblog/archive/2008/05/14/timely-information-via-georss.aspx
Cyclones in Myanmar. Fires in Florida. Earthquakes in China. Timely information is critical for learning about events as they happen, and subsequently how to respond and what to do in their aftermath. One of the ways that timely geographic information is published is via GeoRSS feeds.
In the upcoming Explorer 480 release GeoRSS feeds are one of the supported connections, joining ArcGIS Server, ArcIMS, and WMS.
Here we've connected to the USGS Shake Map feed, and we're showing the popup content for the 7.9 quake that hit China on Monday, May 12.
Below we've connected to another USGS GeoRSS feed publishing all the magnitude 5+ quakes worldwide. Again we're in China, in the vicinity of the disastrous 7.9 quake. You can see the strong aftershocks that followed the original temblor.
Filed under: Explorer 480, GeoRSS, Earthquake
Explorer at Where 2.0
http://blogs.esri.com/Info/blogs/arcgisexplorerblog/archive/2008/05/13/explorer-at-where-2-0.aspx
Earlier this morning here at Where 2.0 in San Francisco, John Hanke, Director of Google Earth and Maps, and Jack Dangermond, ESRI President, partnered in a presentation which showcased some of the capabilities of ArcGIS Server 9.3. ArcGIS Server was used to publish KML that was viewed in Google Earth. The KML showed the result of a fire model with predicted burn times from the current fire perimeter (red line at right).
While ArcGIS Explorer is tightly coupled with ArcGIS Server, and has been designed specifically to leverage ArcGIS Server capabilities, ESRI's open architecture also provides support for Google Earth, Google Maps, Virtual Earth, and other custom viewers.
In the ESRI booth at the Where 2.0 conference we're using the same KML and ArcGIS Server-based maps in Explorer. Here we've taken things a little further with the use of the topo map service available from the Explorer Resource Center and the swipe tool. We used the swipe behavior option to swipe just the selected layer. You can set this option by choosing Tools > Options, and then clicking Layer Appearance.
onsdag den 14. maj 2008
Business Globes 1.0
http://www.directionsmag.com/article.php?article_id=2764
Business Globes 1.0 By Joe Francica , Editor-in-Chief and Vice Publisher, Directions Magazine May 14, 2008
What is it you like about Google Earth, really? Satellite images or the "zooming" factor? I like zooming around the earth because it makes me feel like the world traveler I'd like to be. I like the fact that I can think about the globe in a way that makes Hyderabad seem close to Huntsville. If you were running a global business, wouldn't you want to feel that way, too?
I see this globe thing as the next tool that will enter the sphere of a business executive's corporate information system. While geotagging YouTube videos might be an interesting way to bring the world closer, the average C-level businessperson wants a bit more. The globe is an apt metaphor for running a multinational business, is it not? I'd start with a sales globe, add my virtual supply chain globe, and maybe give my virtual employee globe to the HR department. I'm just not an HR kind of guy. But make no mistake, the globe can be a tool to better visualize business operations, which include offices and assets in multiple locations.
Businesses cry for a 360-degree view of their business. For a time, enterprise resource planning (ERP) was seen as the solution that would create this view. But as companies began to implement ERP systems and then system integrators were taking too long to implement the solution, cost overruns ensued and many company executives became disenchanted. Next, customer relationship management (CRM) arrived on the scene and that seemed easier for an enterprise to swallow because it focused more on sales and marketing. In fact, solutions like Salesforce.com seemed very appropriate in a Web 2.0 kind of way because software as a service makes a lot of sense for many budget conscious companies. And now it's business intelligence (BI). What's the hot, bolted-on application to BI? That would be location technology and the ability to look at corporate intelligence from a geographic perspective.
With corporate data rife with geospatial attributes, it makes sense to evaluate business processes from a geographic vantage point. So, again, what is it that you like about "globes" - Google Earth, Virtual Earth, TITAN, ArcGIS Explore, or something "freer" like WorldWind? "Globes" are platforms for executives to better understand business process relationships and quickly retrieve corporate intelligence. The globe metaphor can be used specifically to develop information databases for industries and applications. I believe we will see "globes" that support retailers, banks and real estate, and others, as well as globes for school districts and homeland security. They would be corporate, organizational or regional. Some of the early adopters have produced specialized globes like that for Virtual Alabama, a visualization platform just for emergency management situations in that state. Still other types of globes will be specific to the individual as a means to better manage assets, both financial and social. Globes will be shared as a Web service, similar in concept to the ERDAS TITAN model that allows collaboration, both public and restricted.
While we all use the Google Earth or Microsoft Virtual Earth globes to view points of interest, satellite imagery or 3D models of buildings, they are too static for business. Businesses want not only to see their own data, they also want to ingest data from many sources, not the least of which is "live," real-time information from other Web services. As much as businesses will analyze their existing customer or supply chain information, they will also seek data that reside outside their business ecosystem. They could be weather- or traffic-related or information from sensors and social networks. Eventually, patterns will emerge leading to actionable location intelligence.
Consider the CNN.com newsroom during the most recent U.S. presidential primaries. Newsman John King became the GIS specialist, drilling down into the most recent county-level polling information. In so doing, he exposed voting patterns that pieced together a geographic perspective for a slice of the American electorate. CNN created a U.S. political "globe." Its electoral information was near real-time, displaying incoming data as polls closed and information was posted and analyzed. The vote count was timely and accurate, and the maps provided details and context. And yet, the coverage exposed a flaw. It lacked the ability to quickly react to a changing geographic phenomenon weather.
In the case of the Ohio primary, we learned that Barack Obama had filed a lawsuit to keep polling places open during an ice storm which had affected the ability of voters to get to the polls. King zoomed into downtown Cleveland for better context. But all he could show was a static image, probably a two-year-old image of a sunny central business district. The minions of CNN news scrambled to get polling locations on the map and indeed they did but the moment was lost. They needed a real-time feed of weather much like what you can already get on The Weather Channel to see dynamic weather data, and the ability to change the transparency of the map to expose weather patterns. They needed more timely data, perhaps a better Web service; they needed a better "globe."
During the Location Intelligence Conference, Dr. Bill Gail of Microsoft spoke about how his company intends to organize data in a variety of ways. He referred to his paradigm as an "Internet globe" - by his definition, a way to build a more realistic, virtual 3D world. His globe is more often directed toward tourism and travel by creating not just building information models (BIM), but capturing the inside of those buildings using close range photogrammetry. The result will be fantastically accurate virtual rooms of popular tourist attractions which might be impossible for 99% of the world's inhabitants to visit, but somehow are brought directly to them through a new "tourism globe." This is exactly the paradigm I would suggest for businesses as well.
My paradigm of the business globe offers CEOs the same opportunity without burning the jet fuel to reach certain corporate assets. It's not that CEOs won't travel when it's important to do so, but think of the access to contextual information on demand that would be possible with an approach similar to Gail's globe.
Businesses and organizations alike could benefit from a deeper understanding of how the components of their organizations interact. I recently heard a presentation by Terry Canning, vice president and general manager of business services for Rogers Communications, a Toronto-based company serving the needs of telecommunication customers throughout Canada. The telecommunications industry is one that must utilize geospatial information to manage effectively. Canning described how his company had used geographic information in the past and found that it could help build comprehensive and actionable growth strategies for future investments. The company needed, as a foundation, knowledge of every address in Canada in both residential and commercial areas. Previously it had marketed to its customers with a mass-market approach but found that this strategy of acquiring and keeping customers needed to change as the company matured. "Sales growth slows because you run out of customers," said Canning. "[We] advertise like hell and wear you down until you say yes.' As growth slows, you have to shift activity into the customers you have and less on those that you want to acquire. As population ages, you see a change in the demographics." Rogers began to shift its marketing dollars into customer retention and maintenance.
Rogers needed a globe for its telecommunications operations. Today Rogers has a robust GIS solution with a Web-based mapping interface accessed by many more decision makers. The company now exposes the information to a higher level of management through an enterprise GIS with an interface more conducive for a wider view of its business operations.
"As management and an executive, I can actually see things. Mapping really allows us to look into our database. Street level really gives us the intelligence to look into the marketplace," said Canning. Rogers began to ask questions about the data it saw: "How come nobody on that street is buying anything from us?" or "Why don't we have any coverage in central New Brunswick?" The answer to the latter became obvious, because the only thing that is there are trees. Answers to all questions came more quickly.
CNN and Rogers Communications have begun to expose more information to those who need it. John King informed a mass audience; Terry Canning provided a more robust tool for his organization, enabling it to sell more to existing customers. What will others do? Will retailers like Wal-Mart configure a globe to manage logistics, sales and marketing from a common platform? Will retailers access their sensor networks which track radio frequency identification (RFID) tags on palettes and individual products to more effectively deliver snow blowers to Sioux Falls during the next snow squall? Will insurance companies more quickly adjust policies based on predictive traffic models or near-real-time incidents? Will they demand real-time data to underwrite policies? Real-time data is becoming a competitive advantage and the organizations that learn to leverage, ingest and visualize dynamic phenomena will be quicker to market.
Even with the rapid pace of geospatial data availability and the platforms on which to visualize information, we are still in a very nascent stage of globe development. Web services are changing the availability of data and new licensing models will play a part in capturing information and building industry-specific globes. But I'm convinced that globes have the potential to deliver the goods.
How is this different from the past when GIS solutions were initially introduced to executive management? The answer is that the visualization tools available today are better understood from a usability perspective. What parent hasn't been amazed to be "schooled" by their kids on how to use Google Earth? Interaction with the globe is just easier. Visual recognition of patterns leads to more questions, and more questions lead to analysis and understanding. The media is embracing this type of tool and businesses will do so, as well. Globes represent a better visual paradigm that will provide the context for the way in which executives see their corporate world.
Eye-Fi Unveils automatic GeoTagging and Hotspot Connectivity with Eye-Fi explore
http://www.directionsmag.com/press.releases/?duty=Show&id=22634&trv=1
Partnerships with Skyhook Wireless and Wayport will Enable Users to Automatically Map Images and Upload Photos On the Go
Burlingame,CA--Eye-Fi (http://www.eye.fi), makers of the world's first wireless memory card for digital cameras, today announced the Eye-Fi Explore, a new card designed to make photo sharing richer, easier and more immediate. Unveiled at the Where 2.0 Conference, the Eye-Fi Explore allows users to upload photos from more than 10,000 hotspots while away from home, and automatically tag their photos with information about where the image was captured.
tirsdag den 13. maj 2008
Google/ESRI Keynote From Where 2.0 2008
John Hanke and Jack Dangermond on the evolution of the GeoWeb.
Intersection of the GeoWeb and GIS - Google and ESRI Partnership
Intersection of the GeoWeb and GIS - Google and ESRI Partnership
May 13th, 2008by Sean Gorman
The morning session of Where 2.0 was very interesting. I had a great speaking slot right after Nokia and right before Google. We launched GeoCommons Finder! and made it through the demo even with a bit of a slow connection. You can join the demo at http://finder.geocommons.com and if you would like a entry key drop me an email at sean@fortiusone.com and I’ll pass one along.
We spent a good bit of time talking about making big geodata sets available in the web browser and having the content available for GIS and GeoWeb users - even spreadsheet jockeys. This is a horn we’ve been blowing for a while, and the great thing about the morning session was the Google presentation following us. Their presentation had a small surprise with Jack Dangermond joining them on stage talking about the interconnection of Google Earth/Maps and ESRI. John Hanke had a nice set up talking about the dark web of GIS data that needs to be exposed to the GeoWeb and how they are working with ESRI to do it.
It’s great to see the big guys on the GeoWeb and GIS respectively working together to bring more data to the masses. While there was a nice canned demo showing ArcGIS 9.3 interacting with Google Earth, it will be interesting to see how it works in the wild and how it scales. My one concern is that is seemed from the demo that the model is still based around the public being passive viewers of GIS professionals work. We can see the output but can we access the data and add our own nuances and perspective to it. Have to wait and see it actually rolls out, but I think democratizing both the data and ability to answer questions with it are still necessary steps for great progress to reach its potential.
Viewzi Takes Visual Search To Another Level
En SearchMe klon – eller er det omvendt?
http://www.readwriteweb.com/archives/viewzi_takes_visual_search_to.php
Visualization tools are slowly making a way for themselves on the web. We have given you an extensive list of some of the best visualizations tools including visual search engines. However, there is one visual search engine that is making a name and breaking the mold: Viewzi, a visual search engine that has been under wraps since October 2007.
Previewing Google Friend Connect: Website owners can make any site social
http://www.google.com/intl/en/press/annc/20080512_friend_connect.html
http://www.google.com/friendconnect/home/moreinfo
Websites that are not social networks may still want to be social -- and now they can be, easily. With Google Friend Connect (see http://www.google.com/friendconnect following this evening's Campfire One), any website owner can add a snippet of code to his or her site and get social features up and running immediately without programming -- picking and choosing from built-in functionality like user registration, invitations, members gallery, message posting, and reviews, as well as third-party applications built by the OpenSocial developer community.
Visitors to any site using Google Friend Connect will be able to see, invite, and interact with new friends, or, using secure authorization APIs, with existing friends from social sites on the web, including Facebook, Google Talk, hi5, orkut, Plaxo, and more.
Attract more visitors. Visitors bring along friends from social networks like Facebook, orkut, and others to interact on your site.
Enrich your site with social features. Choose engaging social features from a catalog of gadgets provided by Google and the OpenSocial developer community.
No programming whatsoever. Just copy and paste snippets of code into your site, and Google Friend Connect does the rest.
Explorer at Where 2.0
http://blogs.esri.com/Info/blogs/arcgisexplorerblog/archive/2008/05/13/explorer-at-where-2-0.aspx
Earlier this morning here at Where 2.0 in San Francisco, John Hanke, Director of Google Earth and Maps, and Jack Dangermond, ESRI President, partnered in a presentation which showcased some of the capabilities of ArcGIS Server 9.3. ArcGIS Server was used to publish KML that was viewed in Google Earth. The KML showed the result of a fire model with predicted burn times from the current fire perimeter (red line at right).
While ArcGIS Explorer is tightly coupled with ArcGIS Server, and has been designed specifically to leverage ArcGIS Server capabilities, ESRI's open architecture also provides support for Google Earth, Google Maps, Virtual Earth, and other custom viewers.

In the ESRI booth at the Where 2.0 conference we're using the same KML and ArcGIS Server-based maps in Explorer. Here we've taken things a little further with the use of the topo map service available from the Explorer Resource Center and the swipe tool. We used the swipe behavior option to swipe just the selected layer. You can set this option by choosing Tools > Options, and then clicking Layer Appearance.
Here's what the single layer swipe looks like:

Earlier this morning here at Where 2.0 in San Francisco, John Hanke, Director of Google Earth and Maps, and Jack Dangermond, ESRI President, partnered in a presentation which showcased some of the capabilities of ArcGIS Server 9.3. ArcGIS Server was used to publish KML that was viewed in Google Earth. The KML showed the result of a fire model with predicted burn times from the current fire perimeter (red line at right).
While ArcGIS Explorer is tightly coupled with ArcGIS Server, and has been designed specifically to leverage ArcGIS Server capabilities, ESRI's open architecture also provides support for Google Earth, Google Maps, Virtual Earth, and other custom viewers.
In the ESRI booth at the Where 2.0 conference we're using the same KML and ArcGIS Server-based maps in Explorer. Here we've taken things a little further with the use of the topo map service available from the Explorer Resource Center and the swipe tool. We used the swipe behavior option to swipe just the selected layer. You can set this option by choosing Tools > Options, and then clicking Layer Appearance.
Here's what the single layer swipe looks like:
tirsdag den 6. maj 2008
Google Earth powerful, though tricky to use, share
http://ap.google.com/article/ALeqM5g2htz9Qvniv6PiteIjgG1-wJLDDAD90D19182
Online photo albums I had prepared for family and friends weren't capturing the essence of my travels to the southern reaches of the world. Then a light bulb clicked as I was exploring Google Earth: Why not use that?
Google Earth is a mapping product much more powerful than the typical Web-based map service. Applying mathematical algorithms to actual satellite and aerial images, with help from topographical data collected from the space shuttle, the free software lets you explore the world from your computer with remarkable realism.
Much of the magic comes from regular users: You can broadly share your expertise on specific locales by adding comments, embedding photos and distributing them to the world.
I couldn't wait to contribute my own majestic views of glaciers, forests and the Beagle Channel — shot during an 18-day trip to Antarctica and South America, the third and fourth continents in my ongoing quest to run a marathon on all seven.
Figuring out how to use Google Earth proved challenging, though, and figuring out how to share my collection with friends was even trickier.
I quickly got overwhelmed because the software can do so much, and I couldn't see where or how to begin. Google Inc.'s online user guide provided so much information that I got impatient with it. Relief finally came once I found step-by-step directions on an online bulletin board.
I began by finding Ushuaia and my hotel on the map, adding what Google calls a "placemark" — which I discovered to be a three-dimensional bookmark that remembers the location, altitude and angle from which you are viewing.
I added several placemarks along the route of the 2007 Fin del Mundo Marathon, a task that proved difficult because nearly half the race was through a national park that appeared primarily as a large green spot on the satellite image.
I had to approximate the route using landmarks such as streams and mountains in the photos. I spent too much time trying to find — without success — the waterfront Kuar restaurant I had passed while running and dined at two nights earlier. (If you can find it, order the seafood crepe.)
Had I brought along a GPS device and "geotagged" my photos with latitude and longitude coordinates, a technique still mostly limited to the tech-savvy and professional photographers, this wouldn't have been an issue.
About 12 miles into the race, I had stopped briefly to take a photo of houses with snow-covered mountains in the background. Initially, I added a simple placemark as if the location were viewed from above — like what you typically see on Web-based maps.
But then I sought to match what was on the screen with what I had in my photo. That meant tilting and rotating the Google Earth view until I was looking north from nearly ground level. The match wasn't perfect, but quite impressive.
I quickly came to appreciate the power and realism of Google Earth.
Next I tried to embed photos in the pop-up balloons attached to each placemark, but this requires a rudimentary knowledge of HTML, the Web programming language. I had to search other Web sites for the syntax I needed to embed images hosted on an outside photo-sharing site, and I had to find the proper tags for injecting line breaks for captions.
Once I had my collection close to my liking, I proceeded to share it — e-mailing my placemarks, photo links and other data in a "KML" file to a handful of friends and colleagues.
Those with Google Earth already installed could open it fine. Others couldn't easily figure out that the file also opens in the Web-based Google Maps service, though without all the 3-D goodies.
I purposely gave few instructions to test how easily others discover features, then checked with them for feedback.
No one noticed the "touring" capability — my favorite part of viewing the completed project. It lets you automate a presentation; the map zooms in and out and moves from one placemark to the next as if you are watching a movie of the race recorded from a helicopter.
When I was ready for Round Two, I added photos from each of the seven marathons I did last year — from Antarctica to the Arctic.
This time, I shared my collection through a public bulletin board. It could take weeks or months for my items to automatically appear when users enable the "Google Earth Community" layer in the software, but people can manually find and download my file directly from the forum. My post received more than 60 views in less than a day — woo-hoo!
With time, I can see adding more data points, such as the more than 30 state capitals I've visited, all the homes I've ever lived in and all the restaurants I've enjoyed, perhaps with links to recipes or photos of my favorite dishes. I'm not expecting anyone else to care about all those minutia of my personal life, but perhaps someone, somewhere out there would find some iota of the information useful.
That said, it'll probably be a while before I get around to continuing the task.
I am fairly comfortable with the basics of Google Earth now, and I do enjoy creating the presentations. But it's like the proverbial tree falling in a forest with no one around to hear it: Sharing my Google Earth creation was far more cumbersome than sending a link to an online photo album with an easy-to-find "slideshow" button.
Although many of Google Earth's features are likely second nature to longtime users, they are relatively new to me and people I know. Google says it is working to improve usability, and I look forward to seeing future iterations.
On the Net:
Google Earth: http://www.google.com/url?q=http://earth.google.com&usg=AFQjCNHBx65aayy2uMBF_2MXHWk7pXZueA
Step-by-step basics: http://www.google.com/url?q=http://bbs.keyhole.com/ubb/showflat.php/Cat/0/Number/16256/an/0/page/0&usg=AFQjCNERs3Kdy2fjOv1VRWUNJFKPcWMAxQ
Gallery of KML files: http://www.google.com/url?q=http://earth.google.com/gallery&usg=AFQjCNFKLOIocfhR3JBoAddr3bpdZYkQBg
Seven marathons: http://www.google.com/url?q=http://tinyurl.com/3s26mj&usg=AFQjCNGGVy5KXdYDzbIEx2W9Np6W1xhr6g
mandag den 5. maj 2008
SDE 9.2's ST_GEOMETRY
http://www.palladiumconsulting.com/blog/sebastian/2008/05/sde-92s-stgeometry-part-one-perhaps.html
Last time, I played a little with SDE 9.2's new ST_GEOMETRY support and was glad I waited for SP5 (!). More experimentation revealed that writing spatial SQL was easy. I've waited a long time to use ESRI-sanctioned methods for asking things like
select *
from zip zi
join county co on (st_intersects(zi.shape, co.shape)=1)
where co.population > 1000000;
.
And it does work. The spatial indexing gets used intelligently, and you can throw (variants of the above) into ArcMap and render spatial queries on the fly. I even started experimenting with doing on-the-fly geoprocessing with things like shape intersections.
I soon noticed that doing anything with more than a few hundred shapes was slow. Of course at first I blamed my queries, the Oracle optimizer, the spatial indexes, anything. But this ain't my first rodeo. That stuff was all fine. No, I was noticing that no matter what I did, ST_GEOMETRY couldn't deal with more than about 1000 shapes per second. Fancy spatial indexes don't do much good when the final geometry-to-geometry filter maxes out on so few shapes.
Why oh why?
Part of the problem seems to be because all ST_GEOMETRY functionality is implemented with an external C DLL, st_shapelib. This is how Oracle wants you to do it. Every call to an ST_GEOMETRY function is made out of process from the Oracle process serving your connection (oracle.exe on Windows) to a spawned executable (extproc.exe on Windows) via pipes or sockets. When intercepting a CREATE TABLE command and jumping in to create an index, these two process switches are no big deal. When determining whether one polygon overlaps another during a join operation over tens of thousands of individual polygons, it is murder. Quantifying the cost of a context switch is tricky, but at the very least it is thousands of cycles. Figure four thousand cycles, plus a few thousand for copying the data back (and forth), plus the (perhaps greater) cost of killing cache locality and dumping all your registers, and it's not a pretty picture. Compare that to the cost of doing the few dozen or hundred operations needed for determining overlap of my typical polygons and it's likely this out-of-process trick is killing performance by a factor of ten or more.
To make sure this wasn't just a fancy theory, I pulled up trusty perfmon.exe and had it count context switches. Here it is ticking along for a while on my idle machine, then executing a very simple query for a couple of seconds.
Can you spot the query? The average number of context switches per second hovers around 850, then spikes to 20,000 during the query, then back.
For completeness, I wrote a test program which simply created two threads which did nothing but relinquish control and loop, trying to get an upper bound on the number of switches I could do. Trusty F# with its concision was useful here.
open System.Threading;;
let rec cswitch () = Thread.Sleep(0); cswitch();;
let makethread () = (new Thread(cswitch)).Start();;
makethread();;
makethread();;
And I was off to about a million context switches per second. That's an unrealistically high number, since the above code is just an infinite loop with no overhead whatsoever. But I would guess that 1 million no-overhead process switches translates to roughly the ~100,000 order of magnitude real-world process switches I was seeing with the st_shapelib calls.
This seems to be a fatal flaw. Oracle's EXTPROC isn't meant for this kind of fine-grained work. The next investigations involve checking out whether Oracle can be sweet talked into running these external processes in-process, but I'm willing to guess the answer is no. So, it was promising, but there's no way this architectural decision gives anyone the kind of speed they're looking for. I'm not enough of an Oracle guru to know what kind of choice ESRI had when they wrote this; let's hope a gun was put to their head.
If nothing can be improved on this front, it's back to Oracle Spatial for SQLy goodness.
lørdag den 3. maj 2008
3D mouse for GIS users
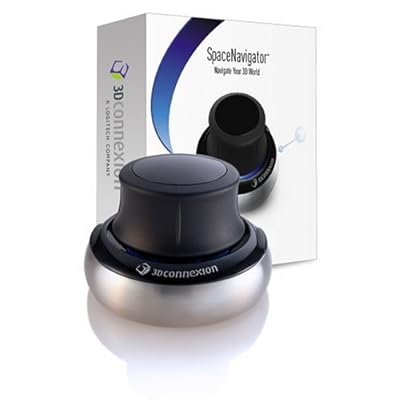
3D mouse for GIS users
3Dconnexion, a Logitech company, announced its SpaceNavigator 3D mouse is now supported by the ESRI ArcGIS Desktop products. Using the SpaceNavigator device, GIS professionals, can simultaneously pan, zoom and rotate camera views to better visualize geographic information when navigating 3D maps and models. The freedom of navigation provided by the SpaceNavigator 3D mouse enhances map and spatial analysis, collapsing the time between viewing and understanding.
The integration of 3D data in GIS applications has grown, changing how GIS users interact with geographic information. Advanced 3D navigation allows ESRI users to explore data-rich environments in a way that cannot be achieved with a mouse and keyboard alone. With the SpaceNavigator 3D mouse, users apply very slight movements to the device’s controller cap to seamlessly fly through 3D terrain.
ArcGIS Desktop supports SpaceNavigator on Windows XP. SpaceNavigator Personal Edition (MSRP USD 59) and SpaceNavigator Standard Edition (MSRP USD99) are available from major online resellers including Amazon, CDW, Dell, and PC Mall as well as directly at http://www.3dconnexion.com/.
Source : http://www.3dconnexion.com
ESRI ArcInfo Commercial of 1990
It’s unbelievable how much has changed over the past 18 years. GIS has envolved and systems are now integrated into company structures. Geospatial Information and Geoservices are available for nearly everyone over the Internet and the popularity of GIS was never as high as today. This video really shows the basics of GIS and what has changed over the years.
fredag den 2. maj 2008
MapWii - Find Local Wii Players
http://apb.directionsmag.com/archives/4233-MapWii-Find-Local-Wii-Players.html
MapWii - Find Local Wii Players
You can play Wii games with others online, but latency means that sometimes there's a bit of delay. The good news is that if you choose players closer by, that latency decreases. So, how to find local players? MapWii. You won't get too local too fast with this Google Maps app. First you pick a country, then a sublevel (state in the U.S.). When I ended up in Massachusetts, many of the folks don't seem to have any Wii games.The site has been up for some time, but I point it out because it's a situation where geography still matters!
http://mapwii.com/wii-number/map.cfm?r=7246&country=57
Abonner på:
Opslag (Atom)