
Bølgen som udeblev ...
/Sik

Quake the waves ...
/Sik
Quote

Read more: http://wcatwc.arh.noaa.gov/2010/02/27/725245/08/ttvu725245-08.jpg
PhotoCity is a game where you can create 3D models out of pictures that you take of the places around you. Every picture you upload actually adds 3D points to the model, which is how you raise your score: 3D points = game points!
The video at the right shows a 3D reconstruction of the Paul Allen library on the University of Washington campus which was made by the efforts of players of PhotoCity. You can see other reconstructions on our Reconstructions page, linked here.
By playing PhotoCity, you help us create the biggest, most complete reconstruction of your campus possible!
Despite the recent explosion of web based cartography tools, making effective maps for data visualization remains a challenge. While tools like Google Maps are great for helping navigate the world they are often poorly suited for thematic mapping, as many features like roads and cities only get in the way of telling compelling stories with data. In fact, even the distance between places can be a distraction – who cares how far away Alaska is when the goal is to make a simple comparison between US states?
To help overcome some of the limitations with existing mapping tools Sunlight Lab is releasing ClearMaps, an ActionScript framework for interactive cartographic visualization. In addition to giving designers and developers more control over presentation the project aims to address some of the common technical challenges faced when building interactive, data driven maps for the web. ClearMaps is designed as a lightweight, flexible set of tools for building complex data visualizations. It is a framework not a plug-and-play component (though it could be a starting point for those wishing to make reusable tools).
Vector maps (EPS) for graphic designers.
Mapas Vectoriales (EPS) para diseñadores gráficos.
Download project / Descarga del proyecto: http://sourceforge.net/projects/epsmapsfordesig/
Features / Características:
Some screenshots / Algunas capturas de pantalla
[...]

Using JavaScript has become increasingly easy over the last few years. Whereas back in the day we needed to know the quirks of every browser, now many libraries such as jQuery, YUI, Dojo and MooTools allow someone who doesn’t even know JavaScript to spruce up boring HTML documents with impressive and shiny effects. By piggy-backing on the CSS selector engine, we have moved away from the complexity and inconsistencies of the DOM and made things much easier.
If you look at some of the code that has been released, though, we do seem to have taken a step backwards. In gaining easier access, we also became a bit sloppy with our code. Finding clearly structured, easy-to-maintain jQuery code is quite tough, which is why many plug-ins do the same thing. Writing one yourself is faster than trying to fathom what other developers have done.
The rules for solid, maintainable and secure JavaScript haven’t changed, though. So, let’s run through the seven sins of JavaScript development that will bite you in the backside when you have to maintain the code later on or hand it over to another party.
We’ve all had to work with code written by other people. We have despaired over the lack of maintainability and documentation as well as weird logic. Funny enough, as developers, we started to see this as normal and got used to ignoring other people’s work and instead writing new code for the same problems over and over, as if we were subconsciously trying to secure our jobs by leaving behind unmaintainable code—code that only we understood, while complaining that no good solutions were out there. [...]
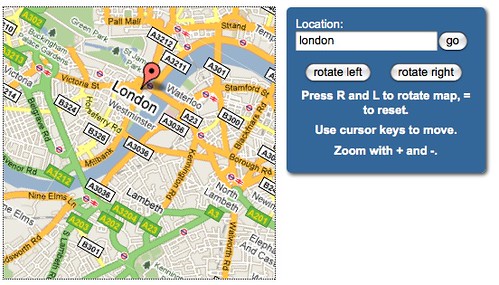
One thing that annoys the heck out of me with maps you see on a screen is that you can’t rotate them. When I look at a real map I constantly turn it around so that I face in the right direction. Google maps lately added this feature in the hybrid and satellite maps but I wanted to do that with the simple maps and also other map providers.
The solution was CSS3. With the rotation transformations you can arbitarily turn elements. Of course this differs again from browser to browser which is why it made sense to me to find a library plugin that does that. Zachary Johnson build one of those and using this together with the Google Maps API it was pretty easy to build a rotating map:
[...]


