onsdag den 30. december 2009

The NYPL Map Rectifier


Smart card ...
/Sik


Cool tool ...
/Sik


Quote

The NYPL Map Rectifier is a tool for digitally aligning ("rectifying") historical maps from the NYPL's collections to match today's precise maps. Visitors can browse already rectified maps or assist the NYPL by aligning a map. Play the video above to tour the site and learn how to rectify a map yourself.

Everyone is welcome to participate!

?t=t&id=1524465
from Atlas of the city of New York, borough of Manhattan. From actual surveys and official plans / by George W. and Walter S. Bromley. (In 2 layers)
about 1 year ago.Unrectified.
?t=t&id=1524458
from Atlas of the city of New York, borough of Manhattan. From actual surveys and official plans / by George W. and Walter S. Bromley. (In 2 layers)
about 1 year ago.Unrectified.
?t=t&id=1524448
from Atlas of the city of New York, borough of Manhattan. From actual surveys and official plans / by George W. and Walter S. Bromley. (In 2 layers)
about 1 year ago.Unrectified.
?t=t&id=1524447
from Atlas of the city of New York, borough of Manhattan. From actual surveys and official plans / by George W. and Walter S. Bromley. (In 2 layers)
about 1 year ago.Unrectified.
?t=t&id=1531750
from Borough of Richmond, Topographical Survey. (In 2 layers)
about 1 year ago.Unrectified.


Read more: http://maps.nypl.org/warper/

Phillip Niemeyer | Picturing the Past 10 Years


Nullerne rinder ud ...
/Sik


The forst decade of this millinium ...
/Sik


Quote


Read more: http://www.nytimes.com/interactive/2009/12/27/opinion/28opchart.html

Amazon Initiative Map Viewer: Spatial Policy Targeting for Incentive-based Ecosystem Service Management


Flot kort ...
/Sik


Nice map ...
/Sik


Quote

Supported by the World Agroforestry Center, the International Center for Tropical Agriculture, and the World Bank, the Amazon Initiative and its partners are developing an interactive map server for environmental policy targeting. The tool uses spatial information from a large variety of sources and allows users to calculate land cover, biomass. and conservation opportunity costs in custom polygons.


Read more: http://www.iamazonica.org.br/IAViewer/

NASA Visualization of 2009 Antarctic Ozone Hole


Ozon hullet er lukket nu mangler vi bare at løse resten af klimakrisen ...
/Sik


We fixed the hole in the ozone layer ... now we need to fix the rest of the climate crisis ...
/Sik


Quote


Read more: http://gisandscience.com/2009/12/29/nasa-visualization-of-2009-antarctic-ozone-hole/

mandag den 28. december 2009

OLPC XO-3: An Impossible $75 Fantasy Tablet I Want to Believe In


Jeg gir' gerne det dobbelte hvis der samtidigt gives en gratis til et barn i Afrika ...
/Sik


I want one ... Double the price and give a child one for free ...
/Sik


Quote


The dual-touchscreen XO-2 was a fantastical concept. But it's nothing on OLPC's XO-3, a hot, messy wet dream of a tablet: All semi-flexible plastic, multitouch, backlit and reflective ereading modes, thinner than an iPhone and $75.

Remember, this is the organization that didn't just scrap the XO-2, but couldn't even tack a touchscreen onto the current XO-1 laptop, which isn't anywhere near a hundred bucks. (Hey, at least they gave up on the dual-touchscreen idea.) I think this sadly says everything about the likelihood of it happening, as much as I'd love to see and play with this thing: "We don't necessarily need to build it," Negroponte told Forbes. "We just need to threaten to build it."

Well, I can't wait to see the XO-4! [Fuse Project, Forbes]


Read more: http://gizmodo.com/5432351/olpc-xo+3-an-impossible-75-fantasy-tablet-i-want-to-believe-in

lørdag den 26. december 2009

Deadly Cold Across Europe and Russia


Hvem sagde 'Den Kolde krig'?
/Sik


Who said 'Cold War'?
/Sik


Quote

Deadly Cold Across Europe and Russia

Posted December 25, 2009
Deadly Cold Across Europe and Russia
Color bar for Deadly Cold Across Europe and Russia
download large image (3 MB, JPEG)acquired December 11 - 18, 2009

A wave of frigid air spilled down over Europe and Russia from the Arctic in mid-December, creating a deadly cold snap. According to BBC.com, at last 90 people had died in Europe, including 79 people, mostly homeless, in Poland. In places, the bitter cold was accompanied by heavy snow, which halted rail and air traffic for several days during the week of Christmas.

This image shows the impact of the cold snap on land surface temperatures across the region from December 11–18, 2009, compared to the 2000–2008 average. The measurements were made by the Moderate Resolution Imaging Spectroradiometer (MODIS) on NASA’s Terra satellite. Places where temperatures were up to 20 degrees Celsius below average are blue, locations where temperatures were average are cream-colored, and places where temperatures were above average are red. Light gray patches show where clouds were so persistent during the week that MODIS could not make measurements of the land surface temperature. The biggest anomalies were in northern Russia, but a swath of below-average temperatures stretched across the countries around the Baltic Sea as well. [...]

Read more: http://earthobservatory.nasa.gov/IOTD/view.php?id=42067

torsdag den 24. december 2009

Map Any Image With New UMapper Release


Se nedenfor ...
/Sik


A tool like Image Cutter from KVT:


/Sik


Quote

Adam DuVander
If you enjoy creating fun, interactive maps, you’ll get lost in the latest functionality from UMapper (our UMapper mashup profile). With it, you can include any image–even one that isn’t a map–in its Flash viewer. [...]

tirsdag den 22. december 2009

Welcome to geo-tee.com


GIS mode ...
/Sik


Dressed up for GIS ...
/Sik


Quote

GEO Maestro

Geo Maestro

$14.50
GIS Swing'n

GIS Swing'n

$14.50
Metadata Hater

Metadata Hater

$14.50
Original Geographer

"OG" Mercator
Original Geographer
$14.50
Topology

Topology
You Complete Me

$14.50
WM4F

Wil Map for Food

$14.50


Here at geo-tee.com we strive to serve up the funny. We dive deep to dig up the humor buried in the world of GIS. We supply apparel for the seasoned old-school GIS'r that was doing GIS with punch cards, to the newbie who just figured out the difference between a datum and a projection. We have a wide range of threads that will be sure to not disappoint. So whether you have been in the game for a while, or just now getting your map on, we have got the goods for you. Enjoy!

Read more: http://www.geo-tee.com/

Diagram of Geek Culture


Hvor er GIS geek'erne ...
/Sik


Where are the GIS geeks ...
/Sik


Quote


Read more: http://ibo.posterous.com/diagram-of-geek-culture

Ford’s SYNC System to Enable “Cars as a Platform”?


Næst efter at være hjemme og at være på arbejde så er bilen vel der hvor vi tilbringer det meste af vores vågne liv ...
/Sik


When not at home or not at work your are in your car ... True mobile apps coming this way ...
/Sik


Quote

Andres Ferrate

Developers working on mashups may want to take note of a recent announcement by Ford that it intends to make SYNC, it’s on-board vehicle system, accessible to developers next year. The general implication is that millions of vehicles could become platforms for all kinds of mashups and apps that integrate with various parts of the SYNC system, including its stereo and navigation modules.

The idea behind the “Mobile Apps Connectivity” concept is to provide an easy way of integrating applications that run on mobile devices with SYNC, thereby allowing drivers and passengers to control the apps using built-in elements of the SYNC system, such as voice controls, in-dash displays, and more. Given Ford’s recent announcement to convert SYNC-enabled vehicles into WiFi hotspots, there is good potential for this hybrid SYNC-mobile app approach to deliver value-added tools and applications. [...]


Read more: http://blog.programmableweb.com/2009/12/22/fords-sync-system-to-enable-cars-as-a-platform/

mandag den 21. december 2009

Mathematical Relationships among Map Scale, Raster Data Resolution, and Map Display Resolution


Du kan altid regne med matematik ...
/Sik


When there is no other truth left there is math ...
/Sik


Quote

If you have used any raster data to make maps you may have at one time or another asked yourself, "What is the appropriate resolution of raster data for the map I am making?" This question is tied closely to a basic principle of map compilation that you may have learned in your beginning cartography course: "Always compile your map from source materials of the same or larger map scales". In our age of digital elevation models and other raster datasets, this basic principle of map compilation can be restated as: "Always create your raster map from data at the same or higher spatial resolution than the ground resolution of your map display grid cells". The ground resolution of your map display grid cells will depend on the scale of your map. An equation you can use that relates map scale (1/x), raster data resolution, and map display resolution is:

1/x = 1 / (pixel ground size [m/pixel] × pixel density [pixels/m]), so that 1 meter on the map represents x meters on the ground

In the simple case of a square cell digital elevation model (DEM), such 30m x 30m UTM grid cells, the optimal ground dimensions of the pixels on the map should be the same (or larger) than the DEM spatial resolution. For example, at a map pixel density of 4000 pixels per meter, the optimal mapping scale would be 1/x = 1 / (30 m/pixel × 4000 pixels/m) = 1:120,000 (or smaller). This recommendation, of course, is for large to medium scale mapping where there is minimal scale distortion across the map projection.

An equal angle DEM grid is more complex because the cell dimensions are equal increments of latitude and longitude. For example, you can see in the figure below that the National Elevation Dataset (NED) 1"× 1" DEM based on the WGS 84 ellipsoid has latitudinal grid cell dimensions that vary slightly from 30.71m at the Equator to 31.02m at 80°N. Let's take 40°N, where the grid cell height is 30.84m, as an example latitude. For the pixels and DEM cells to be of the same spatial resolution, the DEM grid cells would be displayed on a Plate Carree projection of scale 1:100,000 at a pixel density of 100,000/30.84 m/pixel = 3,243 pixels/m or 32.43 pixels/cm, which is at the pixel resolution where individual pixels may just be distinguishable to those with excellent vision.

Resolution Diagram

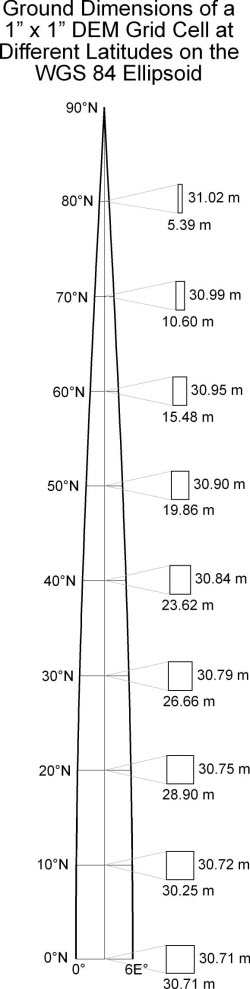
The longitudinal relationship is slightly more complex because the horizontal DEM grid cell dimension decreases with the cosine of the latitude. For example, a NED 1"× 1" DEM grid cell at 40°N has a horizontal dimension of 30.84m × cos (40°) or 23.62 m, a significant increase in spatial resolution.

Plate Carrée Projection Example

The east-west scale distortion on the Plate Carrée projection ( x = longitude, y = latitude) is given by 1/cos(latitude), so the east-west scale factor at 40° would be 1/cos(40°) or 1.3054. Hence, a map grid cell on the Plate Carrée projection at 40° would have a vertical scale of 1:100,000 and a horizontal scale of 1.3054/100,000 = 1/76,600. This increase in scale horizontally means that the horizontal grid cell dimension is 30.84m/1.3054 = 23.62m, the same as the DEM grid cell horizontal resolution at this latitude. The map projection grid density here will be 76,600/23.62m = 3,243pixels/m or 32.43 pixels/cm, the same as the vertical density, as we see in the square pixels that comprise the Plate Carrée projection.

Mercator Projection Example

The first thing we need to know about the Mercator projection (x = longitude, y = ln(tan(π/4 + lat./2) is that both its north-south and east-west scale distortion is given by the equation 1/cos(latitude). Let’s say we make a projection with a display resolution of 40 pix/cm or 4,000 pix/m so that the size of a pixel on the ground equals the resolution of a 1"× 1" DEM based on an authalic sphere with circumference 40,030km, or 30.89 meters per second of latitude and longitude at the Equator. For a pixel at this 4,000 pixel/m density to cover a ground area of 30.89 by 30.89 meters at the Equator, the map scale must be 1/x = 1/(30.89 × 4,000) = 1/123,549. At this scale the DEM resolution at the Equator equals the ground dimensions of the pixel -- an ideal mapping situation since the DEM grid cells and map pixels are at the same spatial resolution!

Moving north and south of the Equator on the Mercator projection, both the latitudinal and longitudinal scale distortion increases by 1/cos(latitude). Map projection scales at 10 degree latitude increments from 0 to 80 degrees for a 1:123,549 scale map at the Equator are in the following table, along with the corresponding ground width dimensions of a pixel on the map. The corresponding east-west resolution of a 1" DEM grid cell is shown in the fourth column.

Lat. Map Pixel Ground East-west Resolution
Scale Dimension of 1" Grid Cell
0 1:123549 30.89 m 30.89 m
10 1:121673 30.41 m 30.41 m
20 1:116099 29.02 m 29.02 m
30 1:106997 26.75 m 26.75 m
40 1:94645 23.66 m 23.66 m
50 1:79416 19.85 m 19.85 m
60 1:61775 15.43 m 15.43 m
70 1:42257 10.56 m 10.56 m
80 1:21454 5.36 m 5.36 m

From these pixel and grid cell ground dimension values, we can see that going moving from the Equator toward the pole, the ground area covered by map pixels systematically decreases according to the cosine of the latitude. This decrease in pixel area on the ground means that progressively coarser DEM grid cells are being used to populate progressively smaller pixel areas on the ground -- an undesirable situation. However, this systematic decrease in pixel ground dimension is identical to the decrease in the east-west extent of 1" grid cells in the DEM, so that the DEM remains optimal for mapping at all latitudes since the pixel and grid cell dimensions are identical in the east-west direction.


Read more: http://blogs.esri.com/Support/blogs/mappingcenter/archive/2009/12/03/Mathematical-Relationships-among-Map-Scale_2C00_-Raster-Data-Resolution_2C00_-and-Map-Display-Resolution.aspx

GIS er forsvundet som selvstændig disciplin


Hvem sagde gisciplin?
/Sik


Only Danish ...
/Sik


Quote

Torben Daarbak

For ikke mange år siden var GIS, geografisk informationssystem, it-løsninger, der havde sine egne afdelinger, der havde sine egne GIS-arbejdsstationer. Det var her, organisationens eller virksomhedens geodata blev behandlet.

Men sådan er det ikke mere.

"GIS er ikke længere noget, man køber som system. GIS er blevet mainstream, og er i dag del af ESDH-løsninger og økonomisystemer. Man integrerer GIS'en i forretningsgange, når man for eksempel laver digital forvaltning. Der ligger kortdata under mange af løsningerne, som brugerne aldrig ser."

Det siger Michael Israelson, som er direktør for offentlige løsninger i den amerikanske GIS-udviklervirksomhed Intergraph og præsident for sammenslutningen af danske GIS-virksomheder i Danmark, Geoforum.

Han forudser, at der vil komme mange flere leverandører af GIS-ydelser. Nogle vil specialisere sig i datalagring og distribution af geodata og vil dermed komme til at stå for infrastrukturdelen af GIS.

Andre leverandører vil henvende sig til slutbrugere som borgere eller eksempelvis sagsbehandlere i kommuner.

"Vi er meget langt fremme på geodata-området i Danmark. Vi har formentlig verdens mest avancerede matrikelsystem, der er en SOA-baseret platform, der er gearet til fremtidige digitale forvaltningsopgaver. Folk ude i verden bliver meget benovede, når vi viser den løsning frem," siger Michael Israelson. [...]


Read more: http://www.computerworld.dk/art/54343?a=rss&i=0

søndag den 20. december 2009

OpenOrienteeringMap


Kortene derude muterer ...
/Sik


Divide and conquer ... Basis maps mutates into new maps ...
/Sik


Quote

OpenOrienteeringMap is an orienteering map of the whole of the UK, based on OpenStreetMap data. There are two map types – “Street-O” and “Pseud-O”.

OpenOrienteeringMap Pseud-O Map Mode

The Pseud-O map is a less serious map (as the level of detail in OSM is not sufficient for “proper” orienteering maps) but attempts to emulate the look and feel of standard orienteering maps.

OpenOrienteeringMap Street-O Map Mode

The Street-O map contains the level of detail equivalent to the Street-O maps used for informal orienteering races around the streets of London and other urban areas in the UK. [...]

Mapping New York

Book

Following on from the success of Mapping London, Mapping New Yorkis a richly illustrated survey of the urban and social history of New York City. From early woodblock engravings to the latest satellite images available of Manhattan, these maps show the intricate story of the development of one of the world’s most populous cities.


backback

A beautifully illustrated book with distinctive maps dating back to the 16th Century, when New York was known as New Amsterdam and founded by the Dutch as a commercial trading post, right up to the present day. Mapping New York provides a pictorial history of the city – both documenting it being both a leader in commerce and one of the most built up urban areas in the world.

Mapping New York focuses on maps from the 20th and 21st century, arranged thematically featuring maps on population, military, water, transport, commerce, crime as well as planning and developing maps and boundaries of the five boroughs. Featuring well known maps such as the New York City subway map, artists’ representations include Claes Oldenburg’s Soft Manhattan #1: Postal Codes from 1966 and the poem, Manhattan, in the shape of the city by Howard Horowitz.

Including the latest satellite images and fantastic projections on the growth of the city,
Mapping New York provides a complete and detailed picture of the unique progression of America’s oldest major city. [...]


Aerial View of Ground Zero, 2001

Map of New York, 1952

Supervue of New York

Buy: http://www.amazon.com/Mapping-New-York-Black-Publishing/dp/1906155828/