Highlights
- Geographers used ArcGIS to summarize and investigate spatial patterns of dancers.
- ArcGIS Spatial Analyst was used to generate density surfaces for each dancer.
- ArcGIS 3D Analyst showed final density surface as a topographic landscape.
| | 
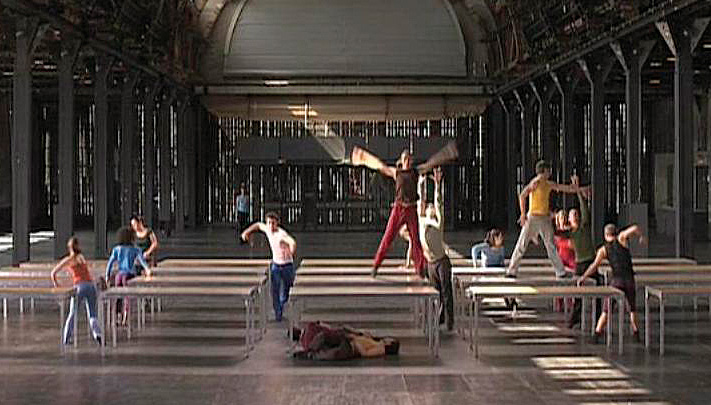
The entire dance involved 17 dancers, and about 16 minutes of activity was recorded. The minute detail of the records, down to centimeter precision and temporal increments of 40 ms, resulted in a dataset of around half a million points. (Video still from One Flat Thing, reproduced by Willian Forsythe.) |
When choreographer William Forsythe invited scientists from across all disciplines to investigate dance and choreography using their disciplinary lenses, it was not obvious that geography and spatial analysis could provide new insights. One of the goals was to make dance more accessible so that anyone, within a matter of seconds, would "get it," and also to explore the possibilities for placing dance at the center of cross-disciplinary dialog and research. After exploring the spatiotemporal data that was generated from tracking each dancer with centimeter and millisecond (ms) precision, a group of geographers saw some familiar and some unfamiliar spatial patterns emerge. Now their findings and visual explanations and those of other researchers at The Ohio State University (OSU) are presented in a new Web project, Synchronous Objects for One Flat Thing, reproduced(synchronousobjects.osu.edu/content.html#/movementDensity), which Forsythe developed in collaboration with Ohio State's Department of Dance and Advanced Computing Center for the Arts and Design.
Forsythe's bold, contemporary works have revolutionized classical ballet for our time, and he is widely viewed as the greatest innovator in this field since George Balanchine. With the formation of the Forsythe Company, based in Germany, he continues to actively explore his multidisciplinary interests in new forms and new modes of presenting his work. His installations constitute progressive additions to his extensive oeuvre: installations for galleries and public spaces, video works, digital media, and publications. The Synchronous Objects project is part of his idea to allow the transformation of choreographic principles from one manifestation—a performance on the stage—to an array of other possibilities, including digital information, animation, and installations.
| | 
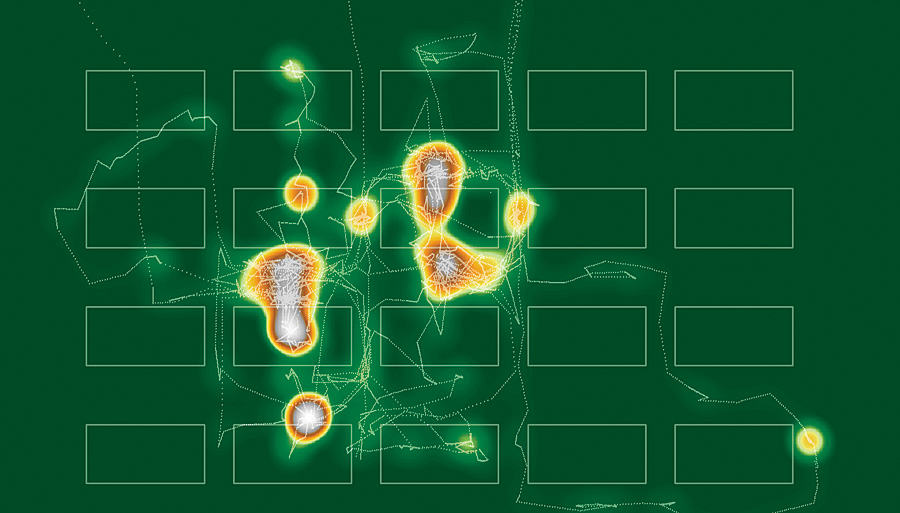
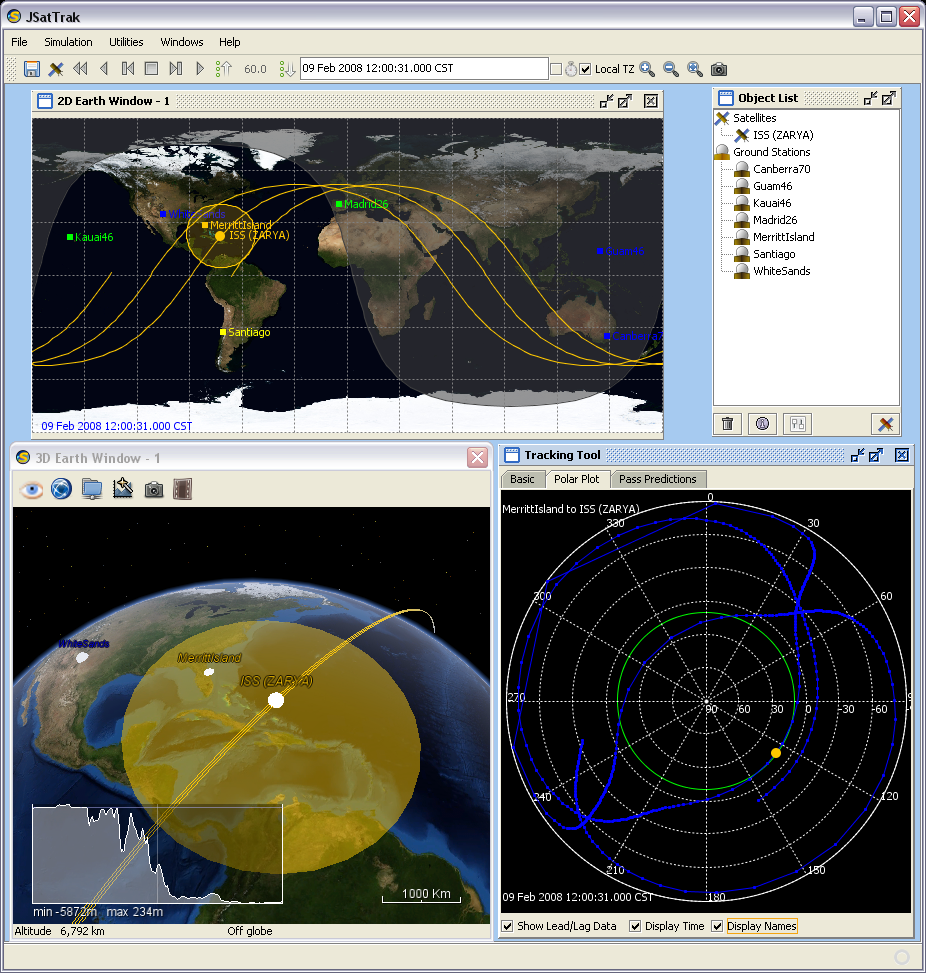
One dancer's point data together with outlines of the tables on the dance floor and a density surface generated with Spatial Analyst from all those points. |
Researchers at Ohio State wanted to explore structures in the dance that were not apparent from watching the dance or might not even be known by the dancers and choreographer themselves. Starting with Forsythe's ensemble dance One Flat Thing, reproduced as the research resource, a diverse team of collaborators from OSU's Computer Science, Dance, Design, Philosophy, Geography, Statistics, and Architecture departments and schools sought to understand the complex structures of interaction in the dance through an array of creative tools, expressive animations, and information graphics. Among these, a team of geographers used ArcGIS software (through its ESRI university site license) to summarize and investigate the spatial patterns of dancers throughout the dance. The spatiotemporal data consisted of point records of each dancer's location in three dimensions as well as a time stamp for each record. The entire dance involved 17 dancers, and about 16 minutes of activity was recorded. The minute detail of the records, down to centimeter precision and temporal increments of 40 milliseconds, resulted in a dataset of around half a million points.
| | 
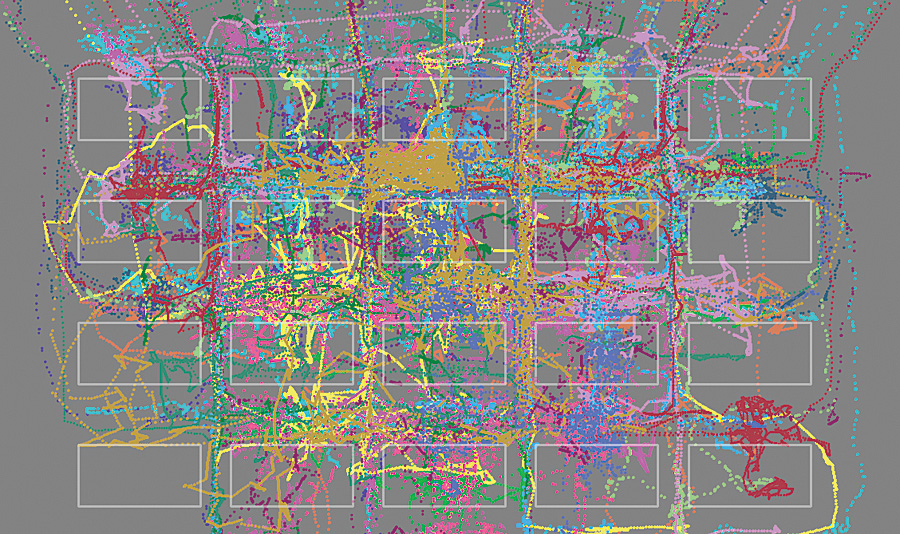
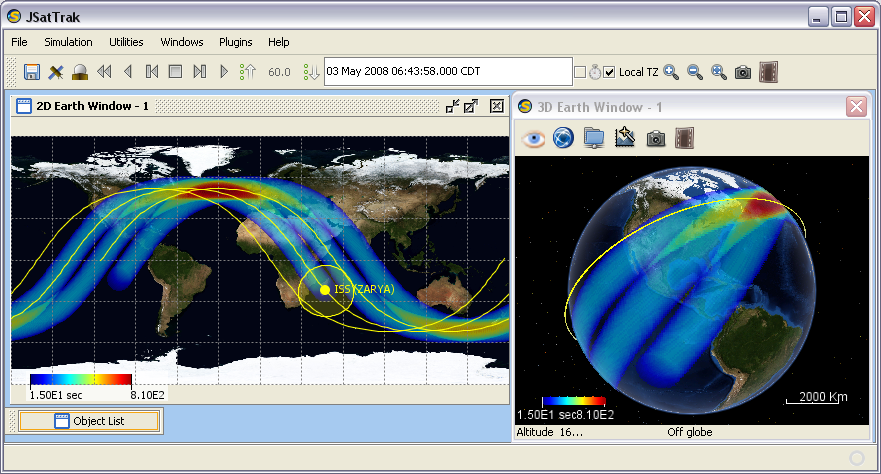
The entire point dataset is shown with outlines of the tables on the dance floor. Each color represents a different dancer, and their locations were recorded at 40 ms intervals. |
The recorded positions of the dancers left a trace of points wherever they moved. To explore potential spatial patterns, the researchers used ArcGIS Spatial Analyst and generated density surfaces for each dancer. Density surfaces are created by superimposing a raster dataset onto the stage, essentially dividing the stage into many small areas represented by pixels, and counting how many points there are within each pixel or within a particular distance from each pixel. A graded color scheme was then added to represent the number of points counted in each area, and the variation in color across the stage informed the researchers about when and where dancers had moved.
By generating a series of density surfaces with 10-second increments, it was possible to create an animation of how the dance evolved through time, and patterns started to emerge as certain areas were used more than others by the dancers. Halfway through the dance, hot spots, or places that were most used by the dancers, showed up as intense, brown-red areas, and places with little activity remained in green shades. The most obvious pattern that emerged from watching the density surface was that most of the activity happened in the center of the stage, but researchers could also observe how the tables that were part of the stage set seemed to act as a structuring element in this dance. Many of the hot spots were located around the back side of the tables.
| | 
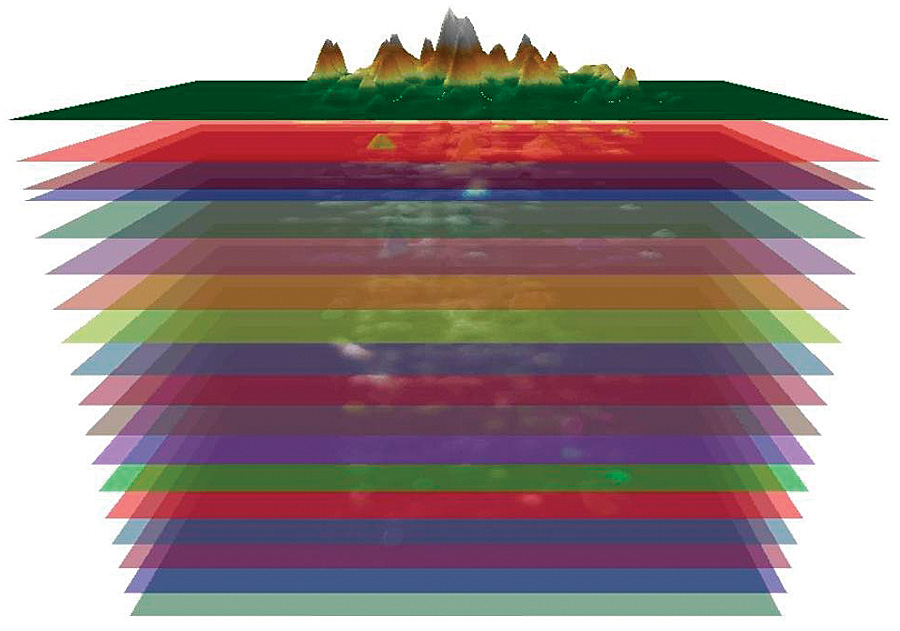
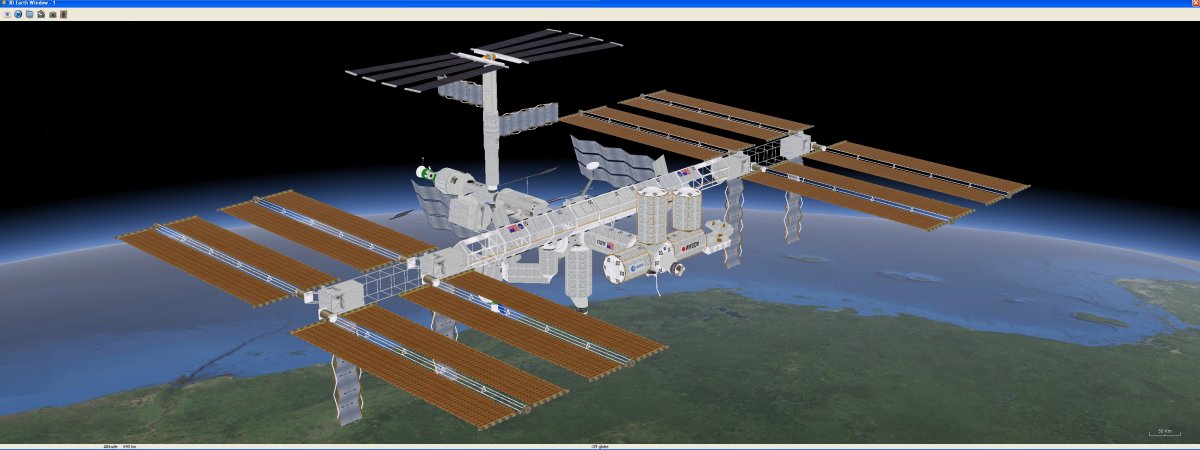
A topgraphic rendering of the density surface summarizing all 17 dancers' activity (top layer), and individual dancer density surfaces also rendered as 3D topographies of different colors (underlying stack of layers). |
To further enrich the visual experience, researchers used the ArcGIS 3D Analyst extension to turn the final density surface into a topographic landscape where the number of points was used as elevation values, creating a dance landscape of mountains, peaks, and valleys. In this representation, sometimes referred to as a statistical surface, the hot spots are depicted as mountaintops or ridges, and the deep valleys and flatlands represent little or no dancer activity. Separate surfaces for each dancer were visualized using this technique through which differences in individual dancer patterns could be explored. These helped highlight distinct patterns where some dancers were very active across the entire dance floor, while others spent most of their time in only a few areas. Most of the animations were created directly in ArcGIS 3D Analyst and exported to movie files for use on the Web site. The Web site and associated blog will also be used as a continually evolving area for communicating and discussing new findings, thoughts, and uses of these objects as tools for communication, discovery, and teaching. [...]


