
Indsaml data, visualiser og simuler ...
/Sik

Collect data, visualize it and then simulate ...
/Sik
Quote
By Grace C. Chung, San Diego Association of Governments, California
When contemplating transportation improvement projects to a regional freeway system, it's important to first understand how the traffic flows on the freeways. Transportation engineers have long employed standardized and reliable metrics to describe system performance. Such metrics work well when communicating with other transportation engineers but less well when consulting with professionals from other fields or communicating with the general public.
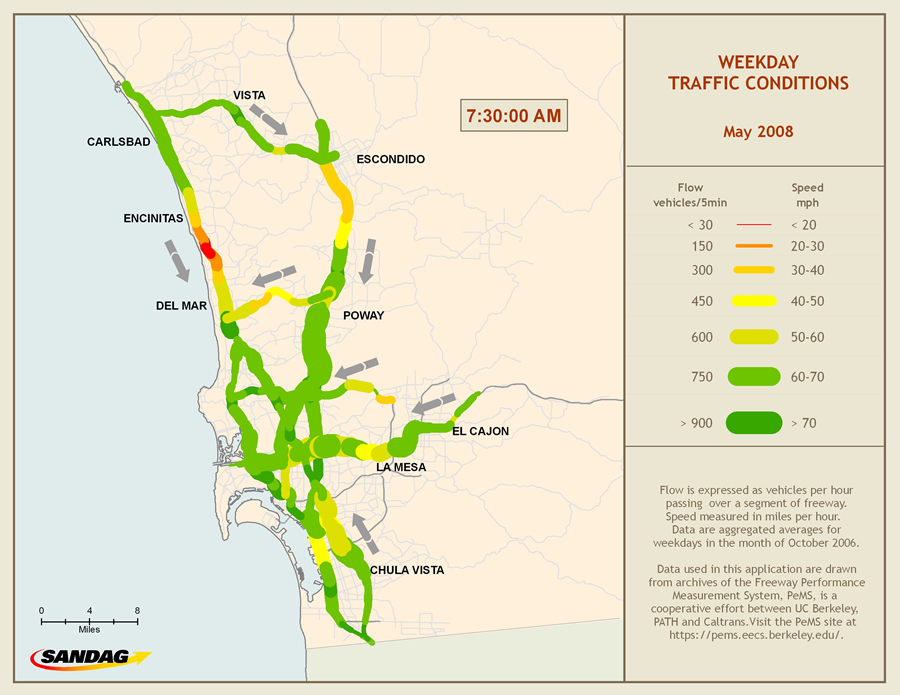 This is a snapshot of SANDAG's traffic conditions animation at one time frame. The animation illustrates the inbound average weekday traffic flow and speed on the San Diego area freeway system in May 2008. |
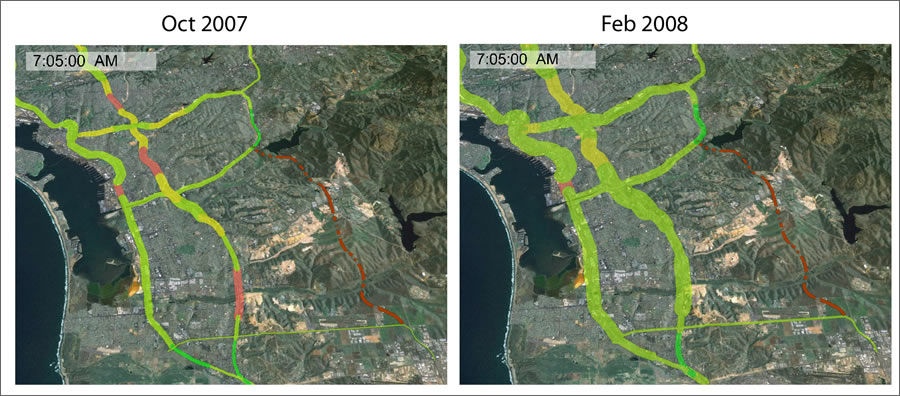
The San Diego Association of Governments (SANDAG), a regional transportation planning agency, has pioneered a visualization technique using the animation tools in ESRI's ArcGIS Desktop and the ArcGIS 3D Analyst extension to create effective, comprehensible depictions of freeway performance. SANDAG uses the animation tools to help planners and the general public visualize a large amount of traffic data at both local and regional scales. GIS animations also help SANDAG transportation planners demonstrate the improvement of the traffic conditions from two different time periods-before and after a construction project-or display the need for future improvements based on model predictions.
Obtaining traffic data in California is fairly easy. The Freeway Performance Measurement System, or PeMS, is a cooperative effort between the University of California, Berkeley, California Partners for Advanced Transit and Highways (PATH) program and the California Department of Transportation (Caltrans). PeMS retrieves the raw, 30-second traffic data from each of reporting Caltrans District Transportation Management Center (TMC). TMC gathers real time traffic data from the loop detectors placed in the freeway roadbed. As vehicles pass over these loop detectors, data on flow, occupancy, and speed across all lanes is acquired and sent to PeMS site at UC Berkeley. The 30-second raw traffic data is filtered, processed; aggregated to 5-minute, lane-by-lane values; and then published on the PeMS Web site. [...]
Read more: http://www.esri.com/news/arcwatch/0709/freeway-traffic.html
Ingen kommentarer:
Send en kommentar