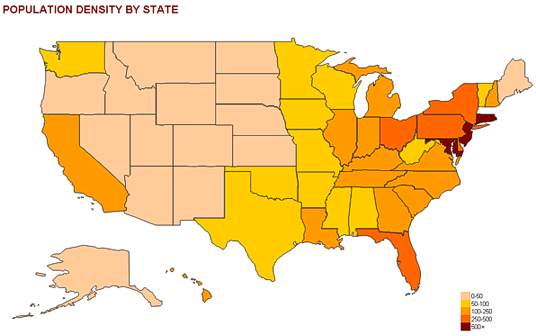
Interessant at det er muligt ... men hvorfor gøre det når det er så meget lettere på så mange andre måder ... ?
/Sik

Nice to see Excel doing a thematic map ... but why do it the hard way when there are so many much easier ways to go ... ?
/Sik
Quote
by

How do you create a map like the one above for your next presentation if you don’t have a mapping tool? Simple, create it in Excel. Easier said than done, right? Well, not really…
Following the “geo-scatterplot”, in this screencast tutorial I’ll show you how to create a thematic map and color-code it, based on your own data. You don’t need add-ins or additional software, just a little time to set it up. Please note that this is not intended to replace even the simplest mapping tool.
To start the tutorial just click the link below:
Screencast: How to create a thematic map in Excel.
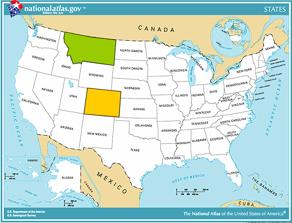
Note that you need a map. You can draw it yourself or you can import it. Drawing a States map is simple:
- Import an image to the Excel file (you can use this one, for example);
- Draw the shapes using the map as a reference.
The other option is to obtain a file. You can get an ESRI Shape file from the National Atlas but you’ll have to convert it to Windows Metafile (WMF) or similar format. [...]
Read more: http://charts.jorgecamoes.com/how-to-create-thematic-map-excel/

Ingen kommentarer:
Send en kommentar