mandag den 31. maj 2010

Augmented Reality and ESRI’s ArcGIS API for Silverlight


Udvid din kortoplevelse ... En dag kan det måske også bruges til noget ...
/Sik


ESRI is now too augmenting reality ...
/Sik

Quote

The lab has just completed a prototype that combines ESRI’s ArcGIS API for Silverlight with the open source Silverlight Augmented Reality Toolkit.

The toolkit allows developers to detect the spatial orientation of a predefined marker. The lab used the orientation information to overlay a map from ESRI’s ArcGIS API for Silverlight. As shown in the video, the map is fully functional even with the perspective distortion.

The demonstration starts with the user browsing a default basemap from ESRI’s resource centerand then performs a search of GeoEye imagery in New Zealand. All imagery is tagged with sensor information such as the capture date, percentage cloud cover and satellite position. In the video, this information is used to order and then offset overlapping imagery. This effect is useful to quickly find imagery based on specific criteria, for example, find the newest imagery with the least amount of cloud cover.

Finally, why not try this demonstration yourself? You will need a computer with a webcam. Clickhere to start the Augmented Reality web application and here to download and print the marker symbol.

Contributed by Richie C.


Read more: http://blogs.esri.com/Dev/blogs/apl/archive/2010/05/17/Augmented-Reality-and-ESRI_1920_s-ArcGIS-API-for-Silverlight.aspx

World Atlas HD for iPad


FYI
/Sik


FYI
/Sik

Quote

Designed specifically for the iPad, National Geographic’s World Atlas HD puts our best maps in the palm of your hand.


Price: $1.99


iTunes App Store


Looking for the iPhone version? click here


:: THE BEST MAPS ::

Unlike other map applications, the National Geographic World Atlas HD utilizes our highest resolution, press-ready images, providing you the same rich detail, accuracy, and artistic beauty found in our award-winning wall maps and bound atlases. The app is preloaded with 3 different styles of world maps, down to country-level detail. With an internet connection, you can continue zooming thru continent-level maps to detailed Bing maps – close enough to see your home!


:: WORLD FLAGS AND FACTS ::

Learn more about the world around you using the up-to-date, expertly researched, Flags and Facts database which contains concise geographic and socio-economic data.


:: SEARCH AND BOOKMARK ::

Bookmark your favorite places with notes or pictures from your photo library. Center the map to your current position on GPS-enabled 3G iPads. Find places by name using the built-in index of major world cities or the full online search of nearly 7 million places.

iPad Screenshot 1
iPad Screenshot 3
iPad Screenshot 2


Read more: http://www.natgeomaps.com/mobile_atlas_hd.html

søndag den 30. maj 2010

Map your data with the Maps API and Fusion Tables


Punkter på et kort er BARE ikke nok ... Nej, gem i stedet data i FusionTables og vis dem på Google Map ... En dag (snart?) vil data fra ESRI/MapInfo bo i skyen og blive vist på Google ... Ét kort - mange kilder ...
/Sik


A few points on a map is so NOT enough ... Store data in FusionTables and visualized in GM ... One day (soon?) ESRI /MapInfo GIS data in the Cloud will too ... One map - many sources ...
/Sik


Quote

If you have ever tried to plot a very large number of overlays on an API map you have probably reached a point at which the performance of your application begins to suffer. With one hundred or so markers, most browsers cope just fine, and clustering solutions like Fluster can help support more. But if you have thousands of overlays that you wish to show, rendering them individually can be problematic.

The Maps API v3 now offers two solutions to this problem. If you have a large volume of geospatial data that can be served as KML, the KmlLayer class can render up to 50,000 features as an overlay that does not impact performance on any browser. To support data sets that are structured as tables, such as a database or spreadsheet, we have also now added the FusionTablesLayer class for rendering data stored in Google Fusion Tables.

Google Fusion Tables is a fascinating new experimental Google Research project offering storage, search, and management of large structured data sets in the cloud. Up to 100MB of data can be stored per table, and each row in a table can have an associated location, line, or polygon feature. Using the FusionTablesLayer class you can render features on an API map as a clickable overlay. When a feature is clicked, the application can access a copy of the complete row of data associated with the feature.

Fusion Tables also supports an SQL like query language, which you can use to filter the features shown on a map. The below map visualises mountain biking trails uploaded to Fusion Tables by mtbguru.com. The slider allows you to filter trails by their length, and the trails shown on the map are updated accordingly. If you click on a trail a custom dialog is shown which indicates the elevation profile for the trail concerned.


The FusionTablesLayer also supports rendering data sets as a heatmap. The below map of beaches in Brazil illustrates the benefit of this. When rendered as point features it is difficult to tell the relative density of the beaches without zooming in further. However once you switch to displaying the data as a heatmap the high density of beaches west of Rio de Janeiro becomes immediately clear.


The combination of Fusion Tables with the Maps API makes it easy to host large sets of data in the cloud, and visualise them in your Maps API application. It is quick and simple to get up and running with Fusion Tables, and the addition of the FusionTableLayer class to Maps API v3 enables Maps applications to be tightly coupled with data hosted in Fusion Tables. Give it a try, and let us know what you think of this experiment in the Groups!


Read more: http://googlegeodevelopers.blogspot.com/2010/05/map-your-data-with-maps-api-and-fusion.html

Dit liv i tal


Er det en evig søgen efter udødelighed ... eller blot en måde at føle sig levende på? Del alt med dine omgivelser ellers kan man (andre) ikke mærke at jeg lever ...

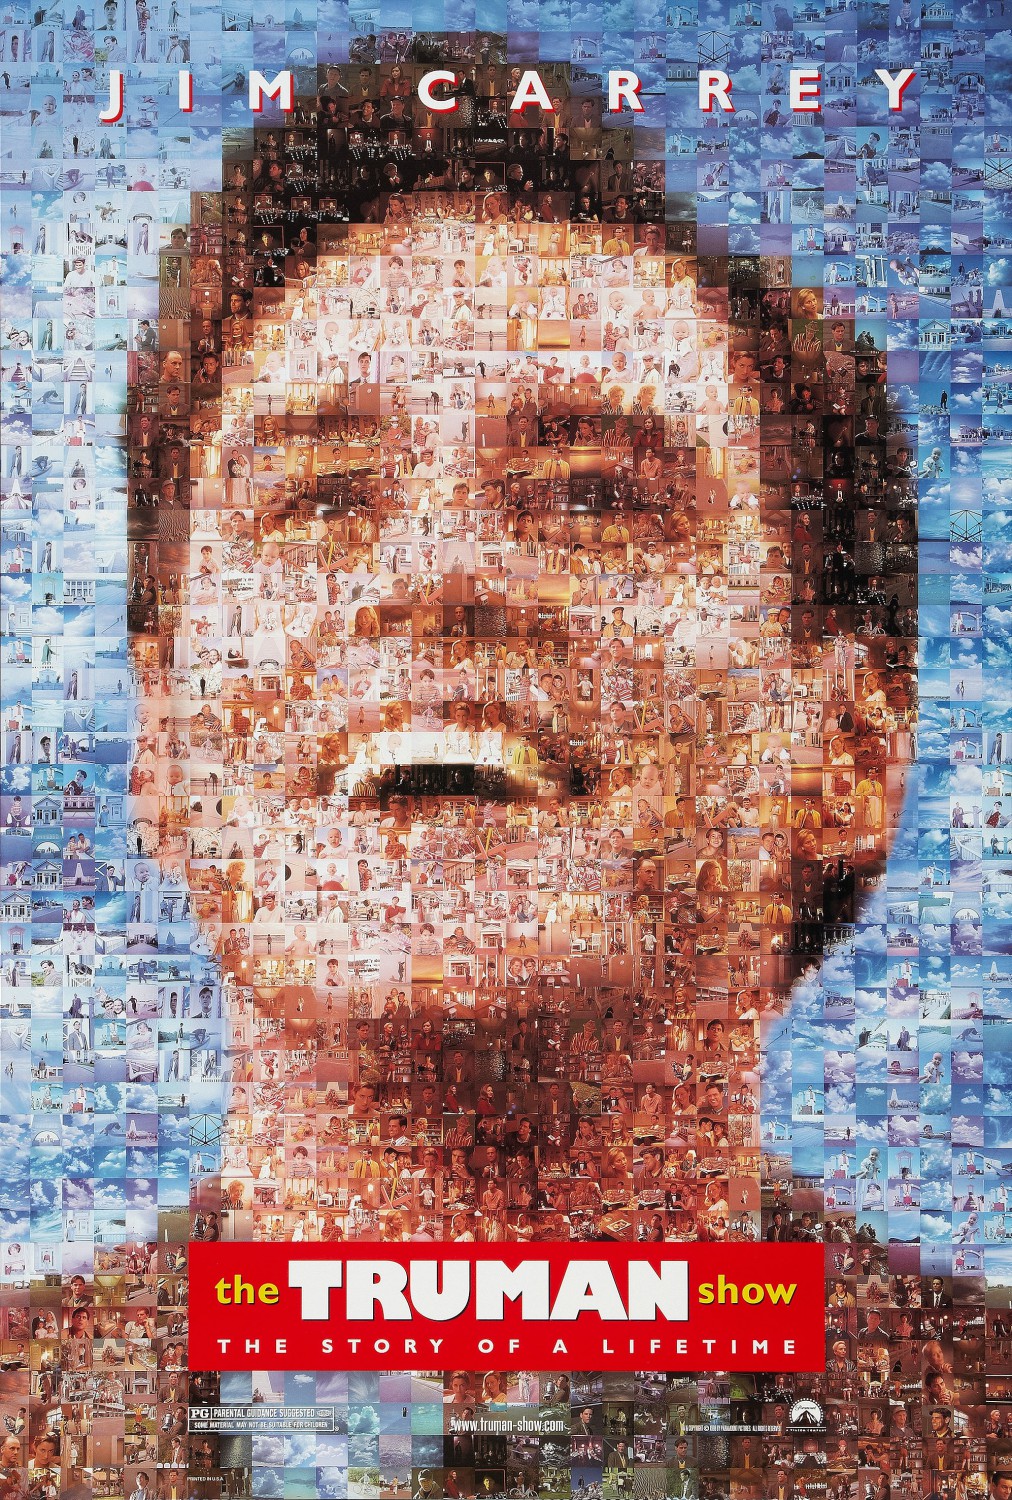
The Truman Show med modsat fortegn ...

/Sik


Only Danish ...
/Sik

Return to Main Page for The Truman Show Posters

Quote
Mål dig selv. Den store dille i San Francisco området lige nu er at indsamle data om sig selv ved hjælp af teknologi som mobiltelefoner og skridttællere. En gang om måneden mødes cirka 100 mennesker og diskuterer deres data, som de undervejs har delt over nettet. Er privatlivet dødt? Når vi samler og deler data om vores meget personlige forhold – ja, faktisk også om vores gener – så rejser spørgsmålet om privatlivets fred sig også. Hvor går grænsen?

Fortæl historien om dit liv med tal i stedet for ord. Fra vandreture med GPS til vægt og DNA – det hele kan bruges!

Det er budskabet fra gruppen the quantified self – det kvantificerede selv – der med base i San Francisco har bredt sig ud over hele USA.

Hver måned mødes en gruppe mennesker, der forsker i sig selv og diskuterer deres resultater. Harddisken har mødt to af stifterne – Gary Wolf og Kevin Kelly – for at finde ud af, hvorfor det pludselig er blevet interessant at bruge teknologi til at indsamle data om ens hverdagsliv og dele disse data med andre mennesker.

Er privatlivet dødt?

Når vi samler og deler data om vores meget personlige forhold – ja, faktisk også om vores gener – så rejser spørgsmålet om privatlivets fred sig også. Hvor går grænsen? Er der overhovedet nogen grænse for hvad vi kan dele og med hvem? Det kigger vi på blandt andet i forbindelse med Facebook og den nyeste ballade om deres indstillinger for privatliv.

Måske er vi allerede langt forbi det der med privatlivet. Den tyske futurist Christian Heller mener i hvert fald, at vi allerede befinder os i en situation med post-privatliv.


Read more: http://www.dr.dk/harddisken

Making Mapping an Accessory to a Crime


Anvend online kort i forbindelse med planlægning af indbrud eller terrorisme vil ive dig hhv. 1 eller 10 år ekstra i spjældet ...
/Sik


In short: using maps for burglarization or terrorism will add either 1 or 10 years to your sentence ...
/Sik


lørdag den 29. maj 2010

Stockholm 3D in Google Earth


En rigtig dejlig by ...
/Sik


Nice town ...
/Sik

3-D digital scanning feature - Capturing History at Mount Rushmore


Jeg kendte engang en fyr som havde et rigtigt menneskekranium (hans far var læge) og han havde møjsommeligt opmålt x,y,z på overfladen og derved skabt at rigtigt flot 3D billede af Frede (det navn som hans far havde givet det ellers navneløse hoved) ...
/Sik


I once knew a guy who had a real human skull (his father was a doctor) and he meticulously measured the x,y,z of the surface - making a stunning 3D image of Fred (the name given to the otherwise nameless guy (or girl)) ...
/Sik

Quote
Mount Rushmore National Memorial is performing a 3-D digital laser scan of the sculpture and other historic resources. These photos show the process and people involved in capturing the laser scan.

Read more: http://www.nps.gov/moru/parknews/digital-scanning-photos-and-multimedia.htm?eid=204714&root_aId=591#e_204714

fredag den 28. maj 2010

Iraq and Afghanistan casualities, home and away


En krig med mange faldne ... eller et fald med mange krige ...
/Sik


Each live lost may one day either be one more reason for hope or one more reason for hopelessness ...
/Sik

Quote

In a collaboration between CNN and Stamen Design, Home and Away offers a sobering view into casualties in Iraq and Afghanistan, since 2001.

On the left is a map that shows hometown locations, and on the right is a map of casualty locations. The two maps are linked such that you see where people are from and where they served. Linked filters on the bottom show distributions of age, location, and date. Select or search for an individual to see further details. Friends and family are also able to submit fond memories of fallen loved ones.

Altogether, the interactive provides a connection between the data and the people behind it. See the full piece on CNN.


Read more: http://edition.cnn.com/SPECIALS/war.casualties/index.html

torsdag den 27. maj 2010

The Geotaggers' World Atlas


Street Credit til Søren for atter engang at gøre information lettere tilgængelig ...
/Sik

Information is Beautiful


Smuk information ...
/Sik


Maps are the visualization of data and information - done right it's close to art ...
/Sik

International number Ones - Because Every Country is Best at Something


Mink skind!!??
/Sik

Introducing the compact cache storage format


Map tiles fylder meget og der er rigtig mange af dem ... Et mere kompakt format beregnet til at jonglere rundt med disse er helt klart på sin plads ...
/Sik


Great news! Have I spend time waiting for tiles to move ...
/Sik


Quote

In ArcGIS Server 10 we've introduced a new storage format for map caches that's designed to make caches easier to move and store.

When you define the tiling scheme for a cache, you'll now see the storage format choice of Exploded or Compact.

Exploded is the same format you worked with in earlier versions of ArcGIS Server, in which each tile is stored as a single file.

BUNDLE files in a compact cacheCompact is the new format. It actually does not zip or compress the tiles in any way; rather, it groups the tiles together in large files called bundles. A single bundle can hold up to about 16,000 tiles. The result is a cache with dozens or hundreds of files, instead of thousands or millions. This speeds copying immensely, and is especially useful in workflows where you use a staging server to create tiles, then move the tiles to a production server.

The compact storage format also yields a smaller cache. Have you ever looked at a pre-ArcGIS Server 10 cache and noticed a discrepancy between “Size” and “Size on Disk”? This is because the smallest size that Windows can use to store a file is 4k by default. Unless you've changed the default format of your disk, any tile that's less than 4k is going to waste space. That wasted space adds up when you have thousands of small tiles. With the compact format, you get a cache where the Size and Size on Disk are essentially the same because you are storing the data in large continuous streams.

ArcGIS clients, including the Web APIs, know how to read the bundle files produced by the compact cache format. If you've coded your own logic to pull tiles out of a virtual directory, you should continue to use the exploded format.

To read more about the compact cache format, see the "Storage settings" section of the topic Available map cache properties.


Read more: http://blogs.esri.com/Dev/blogs/arcgisserver/archive/2010/05/27/Introducing-the-compact-cache-storage-format.aspx

onsdag den 26. maj 2010

9/11 Memorial in Google Earth


Snart 10 år efter er der stadig ingen erstatning for de to tårne ...
/Sik


Next year it'll be 10 years ago ... And still no replacement of the two towers ...
/Sik

Quote
Experience the 9/11 Memorial in Google Earth. Now people can visit and explore the 9/11 site - virtually.


Read more: http://www.youtube.com/watch?v=n4uo-H2oVxQ

mandag den 24. maj 2010

The Google Pacman Game

Local Globes


Tilbage i '88 læste jeg Den lille prins - han ville have elsket disse små hjemmelavede kloder ...
/Sik


Made me think about The Little Prince ...
/Sik


13-Year-Old Climbs Everest


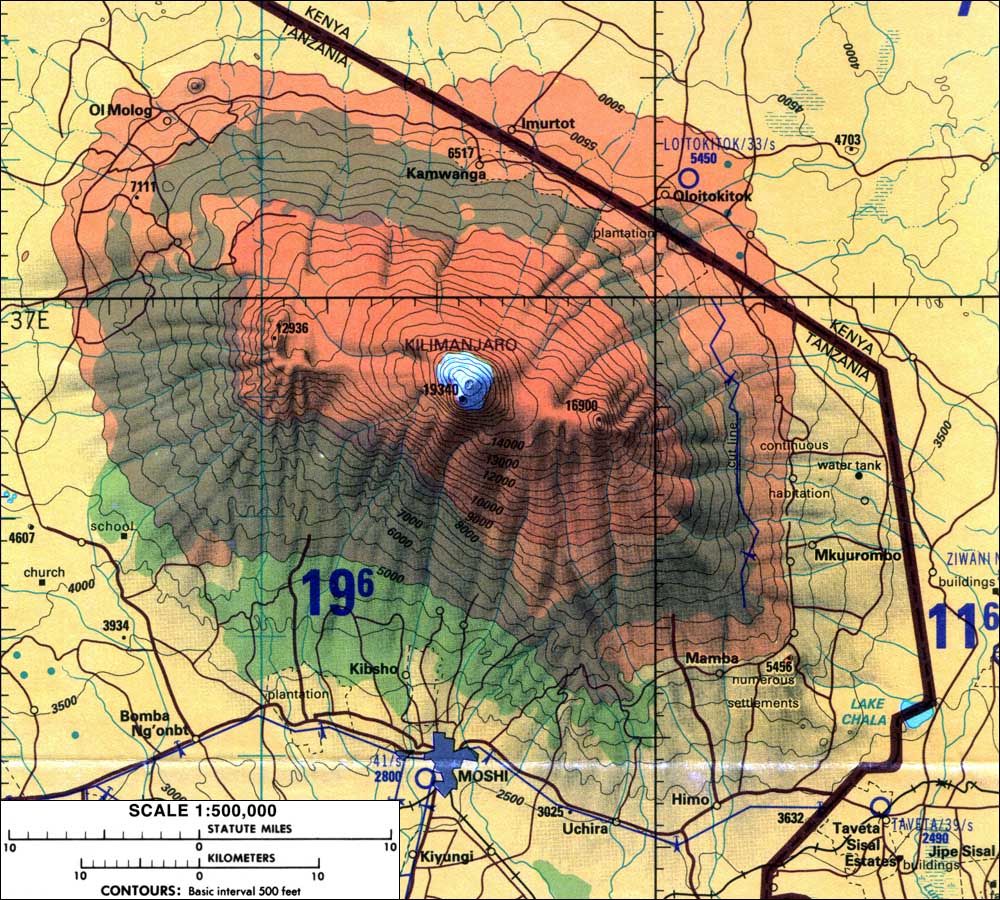
Jeg har stadig en drøm om at 'bestige' Kilimanjaro ... en gang ...
/Sik


Cool ... One day I will be standing on Kibo peak ... Not that it comes even close ...
/Sik


Quote

The youngest climber to reach the peak of Mount Everest hugged his tearful companions Saturday and told them he loved them. Then 13-year-old Jordan Romero took a satellite phone and called his mother, Leigh Anne Drake.

“He says, ‘Mom, I’m calling you from the top of the world,’ ” a giddy Drake said from California, where she had been tracking her son’s progress online by GPS.

After climbing the world’s highest mountain, at 29,035 feet above sea level, Jordan is just one climb from reaching the highest peaks on all seven continents.


Read more: http://www.nytimes.com/2010/05/23/sports/23sportsbriefs-jordan.html