http://www.informi.dk/index.php?id=806&tx_ttnews[swords]=analyst&tx_ttnews[tt_news]=12&tx_ttnews[backPid]=1082&cHash=8e835fed88
Business Analyst Online lanceret
Af: Informi GIS A/S
Informi GIS har lanceret sin nye web løsning, Business Analyst Online, med data fra nogle af Danmarks førende leverandører: Krak, Danmarks Statistik og MultiGeo.
Med den nye online tjeneste, Business Analyst Online, er forretningsanalyser ikke længere forbeholdt store virksomheder med enorme marketingbudgetter. Forretningsanalyser kan nu foretages og leveres via nettet. Det særlige ved løsningen, er, at den kobler demografiske data og
virksomhedsdata med geografi. Det betyder, at informationerne stedbestemmes.
Fremgangsmåden på www.bao.dk er enkel:
Først vælges de oplysninger, du gerne vil have. Det kan være huspriser, informationer om virksomheder eller f.eks. børnefamiliers forbrugsmønstre.
Hernæst vælges det område, du vil have informationerne for. Du kan vælge by, postnummer og kommune eller søge direkte på vejnavn.
Når du er tilfreds med analysen og har godkendt, modtages den via e-mail.
tirsdag den 22. april 2008
torsdag den 17. april 2008
Triple your ESRI Floating Licenses with OpenLM 1.5.0
http://www.directionsmag.com/press.releases/index.php?duty=Show&id=22145&trv=1
Triple your ESRI Floating Licenses with OpenLM 1.5.0 April 16, 2008
Company: Global Maps - OpenLMIndustry: Software DevelopmentLocation: Kibbutz Givat Haim Ihud, Israel
Software developer Global Maps Inc. announced the launching of the new version of OpenLM for ESRI ArcGIS software.The software is available for download and EVALUATION at the OpenLM web site.OpenLM for ESRI ArcGIS is designed to improve the use of the popular ESRI Desktop ArcGIS family of products: ArcView, ArcEditor and ArcInfo.OpenLM offers a dramatic improvement in the availability of software licenses to end users and has a significant influence on users productivity.OpenLM provide a very cost effective replacement of FLEXnet and SAMreport.
The main focus of OpenLM version 1.5.0 is to provide support for organizations who work with multiple servers in various timezones. In addition, the new version provides connectivity to the Active Directory and OpenLM plans to offer important management tools, in the following versions at the near future.New OpenLM features for ESRI ArcGIS include:
* A new tool is prompting the user to release unused extensions.
* Ability to exclude folders, so documents inexcluded folders will not be saved by OpenLM.
* Ability to control IO and CPU usage levels, whichare used to determine if software is active or noneactive.
* Ability to work with unlimited FLEXlm servers - including servers in different timezones.
* Support for FLEXlm redundant server configuration(three or five FLEXlm that work together).
* Significant performance improvements in OpenLM EasyAdmin.
* Ability to connect OpenLM server to ActiveDirectory, in order to display additional user's information.
* Ability to hide the OpemLM Agent from the users bythe system administrator.
* Actual product name in the "license usageinformation" and EasyAdmin, instead of the FLEXlm name (FEATURE) of the software.
* Ability to "Filter" licenses list in the EasyAdmin - very useful for large organizations withconsiderable amount of licenses.
* Option to avoid license information refresh at eachquery - important for big organizations withnumerous amount of licenses.
* Option to limit user access, and deny the ability to query license status information for specificservers.
* OpenLM Agent displays the software version of theAgent and OpenLM Server.
* OpenLM Server version is displayed in theConfiguration Form title bar.
* New "user activity" report allows you to queryactivity for each user/feature combination.
* If you bill projects for software usage you can nowuse EasyAdmin to get the billing report.
For more information please contact:Regev Doron, CMOreggev@openlm.comOffice 972-4-6308085Mobile 972-52-6811094Global Maps is a Carbon Neutral Company - we print ONLY when we have to
Doron Regev (regev@openlm.com)Phone: 972-4-6308085
tirsdag den 15. april 2008
Google Data Center Locations (and a Sidenote on Supercomputers)
http://blogoscoped.com/archive/2008-04-14-n26.html
Google Data Center Locations (and a Sidenote on Supercomputers)

Google hosts what might be the world’s biggest supercomputer owned by a single company*; rather than a single machine, it’s a dispersed network made of smaller machines, though. Now Pingdom (a neat paid service that can alert you when your site is down) put together a map of Google data centers based on approximate information from the unofficial Google Data Center FAQ. Pingdom writes, “If you include data centers that are under construction, Google has 19 locations in the US where they operate data centers, 12 in Europe, one in Russia, one in South America, and three in Asia. Not all of the locations are dedicated Google data centers, since they sometimes lease space in other companies’ data centers.” But as the unofficial FAQ disclaims in regards to the number of data centers, “Nobody knows for sure, and the company isn’t saying.”
*The world’s biggest supercomputer owned by no particular single entity, on the other hand, might be the web itself – the global consciousness, if you will. It’s made up of us humans and our thoughts, but if we want to approach it in technical terms (which is just one of the many ways to see it), all of its nodes are individual sites crunching information day in and out. A blog and forum like this, for instance, is crunching information related to the subject “Google,” but there are other nodes covering politics, art, technology in general, sports and entertainment, and so on. Each individual node can reprocess the output of another more specialized node for a given subject. As individual task outputs are cached under permalinks, the solving of new tasks is sped up; e.g. to integrate a bit of another topic into a blog post I can jump over to a Wikipedia entry to find the cached “preprocessing” of hundreds of other people, all of who in turn might have used information from all over the web.
Some nodes are filters or prisms to the online world (e.g. a link blog or feed reader); some nodes are aggregation meeting points for users (e.g. a forum or wiki); some nodes deliver input from the real world (e.g. a webcam or a traditional news site); some nodes are corrective nodes to other nodes (e.g. a watch blog, or the comments in a blog); some nodes determine ranking of importance (e.g. Google); some nodes are gateways to channel “processing power” – our thoughts applied to a particular subject –, determining which subjects are worth crunching (e.g. Reddit or Digg). Over time, the system at large may reject nodes that do not interact (like nodes causing censorship, nodes behind paywalls, nodes that don’t reintegrate diverse feedback due to a conflict of interest), and emphasize such nodes that do (like nodes using free licensing, open comments, embeddable widgets, or standard registration systems).
But in all this, different nodes in the system may have opposing information points; if the cumulative balance of these information points is about equal to each other, then you won’t be able to find an easy answer – if you request the result to the question “when was Cary Grant born?” via a search engine, you will get a rather plain answer, whereas a question like “who is the ideal candidate for my country’s presidency?” might yield ambiguity. As this network of opinions is so loosely coupled by design, no instance can single-handedly resolve such ambiguity, or – at the moment – truly tell us which questions are worth asking in the first place.
mandag den 14. april 2008
Showing ESRI Shapefile Layers on a Virtual Earth Map: a simple HowTo
http://www.viawindowslive.com/Blog.aspx?ItemId=19101
http://www.codeplex.com/SharpMap
Showing ESRI Shapefile Layers on a Virtual Earth Map: a simple HowTo
If you've ever tried to find a way to display an ESRI ShapeFile on a Virtual Earth map, you'll have probably noticed how little information there is on the Internet about how to accomplish this apparently arduous task.
As a matter of fact, I needed to do exactly this while adding some collateral features to the software Serena and I are developing for our thesis, but after some Googling, I found that there was (and there still is) almost no useful information on how to achieve integration between Virtual Earth and ESRI Shapefiles.
So I had to figure out what I judge a rather clean solution by myself. After all, I thought I could fill the void on this topic and help someone else avoid to switch "lazy mode" off by writing an article about it ;)
By the way, with the technique I'm describing, you're going to be able to not only display Shapefiles as layers on Virtual Earth, but also interact with them in countless ways: extract data from them, maybe show data associated with a shape when you click on it on the map, even modify or create new Shapefiles. All of this care of SharpMap, one of the best (if not the best) open source .NET libraries for GIS.
Actually, SharpMap does much, much more than this... it even has a performing rendering engine for spatial data, so it really is an understatement to think of it as a mere instrument to get ESRI data into our Virtual Earth maps. In fact I strongly recommend to go and give a look at the SharpMap project page on CodePlex.
Showing ESRI Shapefile Layers on a Virtual Earth Map: a simple HowTo
http://www.viawindowslive.com/Blog.aspx?ItemId=19101
http://www.codeplex.com/SharpMap
Showing ESRI Shapefile Layers on a Virtual Earth Map: a simple HowTo
If you've ever tried to find a way to display an ESRI ShapeFile on a Virtual Earth map, you'll have probably noticed how little information there is on the Internet about how to accomplish this apparently arduous task.
As a matter of fact, I needed to do exactly this while adding some collateral features to the software Serena and I are developing for our thesis, but after some Googling, I found that there was (and there still is) almost no useful information on how to achieve integration between Virtual Earth and ESRI Shapefiles.
So I had to figure out what I judge a rather clean solution by myself. After all, I thought I could fill the void on this topic and help someone else avoid to switch "lazy mode" off by writing an article about it ;)
By the way, with the technique I'm describing, you're going to be able to not only display Shapefiles as layers on Virtual Earth, but also interact with them in countless ways: extract data from them, maybe show data associated with a shape when you click on it on the map, even modify or create new Shapefiles. All of this care of SharpMap, one of the best (if not the best) open source .NET libraries for GIS.
Actually, SharpMap does much, much more than this... it even has a performing rendering engine for spatial data, so it really is an understatement to think of it as a mere instrument to get ESRI data into our Virtual Earth maps. In fact I strongly recommend to go and give a look at the SharpMap project page on CodePlex.
http://www.codeplex.com/SharpMap
Showing ESRI Shapefile Layers on a Virtual Earth Map: a simple HowTo
If you've ever tried to find a way to display an ESRI ShapeFile on a Virtual Earth map, you'll have probably noticed how little information there is on the Internet about how to accomplish this apparently arduous task.
As a matter of fact, I needed to do exactly this while adding some collateral features to the software Serena and I are developing for our thesis, but after some Googling, I found that there was (and there still is) almost no useful information on how to achieve integration between Virtual Earth and ESRI Shapefiles.
So I had to figure out what I judge a rather clean solution by myself. After all, I thought I could fill the void on this topic and help someone else avoid to switch "lazy mode" off by writing an article about it ;)
By the way, with the technique I'm describing, you're going to be able to not only display Shapefiles as layers on Virtual Earth, but also interact with them in countless ways: extract data from them, maybe show data associated with a shape when you click on it on the map, even modify or create new Shapefiles. All of this care of SharpMap, one of the best (if not the best) open source .NET libraries for GIS.
Actually, SharpMap does much, much more than this... it even has a performing rendering engine for spatial data, so it really is an understatement to think of it as a mere instrument to get ESRI data into our Virtual Earth maps. In fact I strongly recommend to go and give a look at the SharpMap project page on CodePlex.


søndag den 13. april 2008
Flex GeoWeb Demo with Y!Map for AS3, ESRI and JavaScript
http://www.flex888.com/2008/04/11/flex-geoweb-demo-with-ymap-for-as3-esri-and-javascript.html
As you’ve known already, the emerging Web 3.0 is all about turning information into data, processing the data to be knowledge and applying the knowledge to make our life better and easier. Let’s put another fact into the mix, there are studies show that 80% the data/information we collected, in business or personal, contains spatial information. I guess that’s why the web map giant Google proudly claimed both terms “Web 3.0″ and “GeoWeb”. Now, the question is, are we (or is Google) really ready for Web 3.0 GeoWeb?
Before answering that question, let’s see if we are capable of handling all the data. In a very simple way, all data is about 4WH (What, Who, When, Where and How) . The 4WH is the foundation of all knowledge as well. In the past several decades IT has spent much of the efforts and resources to fine tune RDBMS for handling data. The most representative technology is data warehouse, which usng dimensional modeling to look/search/analyze data in many angles (dimensions). However, if you know something about data warehouse, you’d find out that regardless how many dimensions created to mining the data, there are all variations of What, Who and When. The “where” part is simply another “what”. Now you know why people are so craze about Google Map and 90% of mashups are web map based. That’s because the “where” part of information is not just another piece of data in the SQL where clause anymore. It’s becoming meaningful to be its true value on the map. Does that mean my answer is, we are ready for Web 3.0 GeoWeb. Wrong, we are not ready until we can go beyond visualizing the “where” data, the spatial information.
What is spatial information? If your answer is “location”, then you are 95% wrong.
Let me throw in something here so that you can have a peek on the magnitude of spatial information. Streets, the most familiar entities on a web map. What is street data in a database? There are data represent segments of curved line or polygon can be visualized, they are data can help drawing the line/polygon on the right place on the map, they are data define how those lines/polygons connected, or how certain lines are over another lines (bridge overheads), they are symbols and annotations that tell you what the streets are, they are more complex data structures represents houses, buildings, parks, lakes, etc. This list can go on an on. And, each single item mentioned here can be modified individually, while maintaining the logic how it relates to other data (intersection, connection, ramp, overhead, one-way, two-way, etc). If you are a data architect or a DBA, you mind must be spinning hard to think how those could be modeled and managed. You must be thinking what I’m thinking, “it’s hard”. What I can tell you is that street network is pretty much considered one simple type of spatial data. How about electric grid, gas lines, water pipes and so on. So, what is spatial information? You got the idea.
You might ask, how to process and analyze the spatial information? Now we are getting somewhere.
It takes a Spatial Information Management (SIM) platform and its services. If you are enterprise person, you must know the three letter soup very well, ERP to manage resource, CRM to manage customer relationships, SCM to manage supply chain, EAM to manage assets, PDM to manage product data, PLM to manage product lifecycle, and now SIM is to enable spatial services and manage spatial information, which help extending all other three-letter enterprise system into true spatial dimension. We can’t move pass the location visualization phase (as Google Map does) into Web 3.0 without SIM. (of cause, spatial information is only a small portion of all information available. So, long way to go with Web 3.0)
A SIM (spatial information managment) platform contains solutions, services, tools, data management and programming technologies, just like the ERP crowd. If you’ve heard of the technology called GIS (geographic information system), then you are close enough to know a bit about SIM. GIS provides all the tools and technologies to support the SIM platform. For example, GeoDatabase, which can be built on top of traditional RDBMS, is for managing the spatial information I mentioned earlier. If you are data architect or DBA, no worry now.
GeoDatabase management handles all the complexity for you. Another one, GeoProcess, which help processing those spatial data by applying whatever scientific or math stuffs those Ph.Ds came up with. It’s all transparent to us IT folks. All we need to do is to use the common IT technologies, programing, web services, SOA, .Net, J2EE, etc. to make IT services spatial rich and add long missed spatial enabled value to business.
It’s time now the geo spatial technology about to take off in both broader enterprise and web space because of the maturity of SIM (spatial information management) platform. I think all the cool kids around the blocks should take some serious looks at it and go beyond merely be proud of putting push-pin on a giant web map.
Flex Builder + Yahoo AS3 + ESRI Javascript API (AGS 9.3)

Flex GeoWeb Demo with Y!Map for AS3, ESRI and JavaScript
Posted by Moxie April 11, 2008 .
On April 11, 2008, Inside RIA featured my article, demonstrating how to program in Flex for GeoWeb applications. The article, entitled “Flex GeoWeb with Yahoo AS3,” contains some good coding explanations. You can access the demo application that hosted at Flex888, right click on Flex to view the Flex and JavaScript source code.
As those with expertise in architecture, enterprise systems and solution development know, Web 3.0 is all about turning information into data, processing the data into knowledge, and then applying knowledge in ways that benefit people’s lives. What many may not know is that 80 percent of the data/information collected, in business and personal applications, contains spatial information. This may be why the Web map giant Google proudly uses the terms “Web 3.0″ and “GeoWeb.” Now, the question is, are we (or is Google) really ready for Web 3.0 GeoWeb?
Before answering that question, let’s look at the nature of the data. All data essentially answers the four Ws–what, who, when, where and how. They are the foundation of all knowledge as well. Over the past several decades, IT professionals have expended a lot of efforts and resources to fine tune RDBMS for handling data. The most representative technology is data warehouse, which uses dimensional modeling to look/search/analyze data in many angles (dimensions). However, regardless of how many dimensions are created to mine the data, they are all variations of answers to the four Ws. The “where” part is simply another aspect of “what.”
This is why people are so crazy about Google Map, and 90 percent of mashups are Web- map based. The “where” part of information is not just another piece of data in the SQL; it’s becoming meaningful and has true value on the map. Does that mean we are ready for Web 3.0 GeoWeb? No, and we will not be ready until we can go beyond visualizing the “where” data to get a better understanding of the spatial information.
What is spatial information? If you answered it is “location,” you are 95 percent wrong.
To get an idea of the magnitude of spatial information, we can think of streets, the most familiar entities on a Web map. What is street data in a database? There are data that represent segments of a curved line or polygon that can be visualized; there are data that can help draw the line/polygon on the right place on the map; there are data that define how those lines/polygons are connected, or how certain lines cross over another lines (bridge overheads); and there are data for symbols and annotations that tell you what the streets are. In addition, there are more complex data structures to represent houses, buildings, parks, lakes and other objects. This list can go on an on. In addition, each single item mentioned above can be modified individually, while maintaining the logic of how it relates to other data (intersection, connection, ramp, overhead, one-way, two-way, etc). If you are a data architect or a DBA, your mind must be spinning thinking of how those data can be modeled and managed. Like me, you are probably thinking, “It’s hard.” What I can tell you is that a street network is considered one simple type of spatial data. How about electric grid, gas lines, water pipes and so on?
Next, one might ask how to process and analyze the spatial information. This requires a Spatial Information Management (SIM) platform and related services. Enterprise professionals are very familiar with the three-letter soup: ERP to manage resources, CRM to manage customer relationships, SCM to manage supply chain, EAM to manage assets, PDM to manage product data, PLM to manage product lifecycle, and now SIM to enable spatial services and manage spatial information. This helps to extend all other three-letter enterprise systems into true spatial dimension. We can’t move past the location visualization phase (as Google Map does) into Web 3.0 without SIM. Of course, spatial information is only a small portion of all information available. Therefore, we have a long way to go with Web 3.0.
A SIM platform contains solutions, services, tools, data management and programming technologies, just like the ERP. If you’ve heard of the geographic information system (GIS) you are close enough to knowing a bit about SIM. GIS provides all the tools and technologies to support the SIM platform. For example, a GeoDatabase, which can be built on top of traditional RDBMS, is for managing the spatial information mentioned earlier. GeoDatabase management handles all the complexity for you. In addition, GeoProcess helps process spatial data by applying scientific and mathematical theory. It’s essentially done for most IT professionals. We can use the common IT technologies, programming, Web services, SOA, .Net, and J2EE to make IT services spatially rich and add long-missed spatially enabled value to business applications.
Now that Geo spatial technology is about to take off in both broader enterprise and Web space applications, owing to the maturity of SIM, most IT professionals will be able to move beyond putting push-pin on a giant Web map.
torsdag den 10. april 2008
TomTom and Garmin Lose Their Way
http://www.businessweek.com/technology/content/apr2008/tc2008048_819969.htm?chan=rss_topEmailedStories_ssi_5
Nokia plans to include navigation features in roughly half of its phones in the next two to four years, Wood says. And while TomTom will sell 14 million to 15 million devices this year, Nokia will sell some 400 million phones this year, roughly half of which will be navigation-ready.
Nokia plans to include navigation features in roughly half of its phones in the next two to four years, Wood says. And while TomTom will sell 14 million to 15 million devices this year, Nokia will sell some 400 million phones this year, roughly half of which will be navigation-ready.
How To Use ArcGIS Server 9.2 On Microsoft Windows With A x64 Processor
http://mandown.co.nz/development/how-to-use-arcgis-server-9-2-on-microsoft-windows-with-a-x64-processor/
How To Use ArcGIS Server 9.2 On Microsoft Windows With A x64 Processor
Development - Thursday, April 10 2008
More and more users out there are making the moving to x64. The processors coming out these days are all x64 an I have noticed recently that users are starting install Microsoft Windows Server 2003 R2 x64 to run their applications. This is good move although there is a little configuration to get ArcGIS Server 9.2 running on Windows Server 2003 or Windows XP or even Windows 2000. This configuration change is to do with the .NET Framework and IIS. You have to enabled 32-bit application support on IIS. This is because ArcGIS Server 9.2 runs as a native 32-bit application on x64.
ArcGIS Server 9.2 and higher is supported on the Intel and AMD 64-bit processor families.
ArcGIS Server is a native 32-bit application. It is certified to run as a 32-bit application on 64-bit (x64) Microsoft Windows.
I run Microsoft Windows Vista x64 on my laptop and this really well with ArcGIS Server 9.2. There is some additional configuration required for IIS 7.0 but the instructions in the technical article cover off all the other operating systems.
Instructions on how to enable this support can be found in a technical article published on the ESRI Support Centre here: http://support.esri.com/index.cfm...
OpenLM 1.5.0 for ESRI ArcGIS (Floating software optimizer)
http://www.gisuser.com/content/view/14393/
OpenLM 1.5.0 for ESRI ArcGIS (Floating software optimizer)
Written by Global Maps Inc.
Wednesday, 09 April 2008Software developer Global Maps Inc. from Kibbutz Givat Haim Ihud in Israel, has announced the launch of the new version of OpenLM for ESRI ArcGIS software.
The software is available for download and EVALUATION at the OpenLM web site.´
OpenLM for ESRI ArcGIS is designed to improve the use of the popular ESRI Desktop ArcGIS family of products: ArcView, ArcEditor and ArcInfo.OpenLM offers a dramatic improvement in the availability of software licenses to end users and has a significant influence on users productivity.
OpenLM also provide a very cost effective replacement of FLEXnet and SAMreport.
The main focus of OpenLM version 1.5.0 is to provide support for organizations who work with multiple servers in various timezones. In addition, the new version provides connectivity to the Active Directory and OpenLM plans to offer important management tools, in the following versions at the near future.
New OpenLM features for ESRI ArcGIS include:
A new tool is prompting the user to release unused extensions. Ability to exclude folders, so documents in excluded folders will not be saved by OpenLM.
Ability to control IO and CPU usage levels, which are used to determine if software is active or none active.
Ability to work with unlimited FLEXlm servers - including servers in different timezones.
Support for FLEXlm redundant server configuration (three or five FLEXlm that work together).
Significant performance improvements in OpenLM EasyAdmin.
Ability to connect OpenLM server to Active Directory, in order to display additional user's information.
Ability to hide the OpemLM Agent from the users by the system administrator. Actual product name in the "license usage information" and EasyAdmin, instead of the FLEXlm name (FEATURE) of the software.
Ability to "Filter" licenses list in the EasyAdmin - very useful for large organizations with considerable amount of licenses.
Option to avoid license information refresh at each query - important for big organizations with numerous amount of licenses.
Option to limit user access, and deny the ability to query license status information for specific servers.
OpenLM Agent displays the software version of the Agent and OpenLM Server. OpenLM Server version is displayed in the Configuration Form title bar. New "user activity" report allows you to query activity for each user/feature combination.
If you bill projects for software usage you can now use EasyAdmin to get the billing report.
http://www.openlm.com/
onsdag den 9. april 2008
Can you read me now?
http://blogs.esri.com/Support/blogs/mappingcenter/archive/2008/04/08/can-you-read-me-now.aspx
Can you read me now?
Text and imagery have had an uneasy relationship since the day they met. Satellite imagery and aerial photographs are the ultimate variable background, which makes any text drawn on them hard to read.
There are plenty of options in ArcMap for displaying text, ranging from changing the style, size, and color of text to adding effects like drop-shadows and halos. Some of these options will work better than others for individual cases, and combinations of these options can work quite well in many cases. The image below contains quite a few possibilities, some are intended to illustrate viable solutions, while others are just there to show failed strategies.

The four groups at the lower right are annotation features, and the highlighting shows different kinds of masks created by the Feature outline mask tool, which can use annotation as input data. The Feature outline mask tool is only available with an ArcInfo License. I set the masks to have between 50% and 75% transparency; this depended on how large the overrun the mask represented; if it was larger, I used a higher percentage of transparency. If you want to try any of these symbols, I exported my map's style (Tools menu -> Styles -> Export Map Styles) and you can download it. 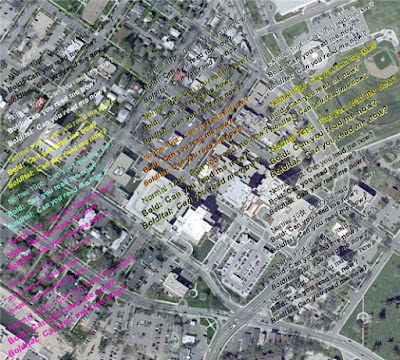
The above examples are simple, i.e., horizontal text, rather than text at an angle or text on a curved baseline. Here is how diagonal text (30 degree angle) appears.

The idea is that you should evaluate what will work best for your purposes and use that approach. No single strategy will work best in all cases. If I'm pressed for a quick answer, I usually say use a yellow or white drop shadow on black text. The reason is that it's fast to set up and it will make more text appear legible, while obscuring the least amount of imagery. A potentially better solution is to use annotation, but that requires more time to create, and to create the masks. Also, drawing the transparent masks adds a little to drawing time.
Can you read me now?
Text and imagery have had an uneasy relationship since the day they met. Satellite imagery and aerial photographs are the ultimate variable background, which makes any text drawn on them hard to read.
There are plenty of options in ArcMap for displaying text, ranging from changing the style, size, and color of text to adding effects like drop-shadows and halos. Some of these options will work better than others for individual cases, and combinations of these options can work quite well in many cases. The image below contains quite a few possibilities, some are intended to illustrate viable solutions, while others are just there to show failed strategies.

These examples are mostly graphic text elements added using the Draw toolbar. Besides changing the size and style of the text, a drop shadow effect is used on the text in the second column. The drop shadow was set up with a 0.4 point shift in the X direction, and a -0.4 point shift in the Y direction. Those shift directions match the direction of drop shadows in Windows and match most people's expectations for drop shadow direction. The text in upper portion of the third column have a halo size of 0.6 points. To learn how to set up these effects see the ArcGIS help topic about Creating text symbols.
The four groups at the lower right are annotation features, and the highlighting shows different kinds of masks created by the Feature outline mask tool, which can use annotation as input data. The Feature outline mask tool is only available with an ArcInfo License. I set the masks to have between 50% and 75% transparency; this depended on how large the overrun the mask represented; if it was larger, I used a higher percentage of transparency. If you want to try any of these symbols, I exported my map's style (Tools menu -> Styles -> Export Map Styles) and you can download it.

The above examples are simple, i.e., horizontal text, rather than text at an angle or text on a curved baseline. Here is how diagonal text (30 degree angle) appears.
So far I've just shown what you can do to the text, you can also subtly change how the image is displayed. For instance by setting the properties for contrast to -20, and brightness to 20, the imagery can be 'pushed' to the background without compromising the detail of the imagery.

The contrast and brightness settings are available in two locations: the first is on the display tab of the layer properties dialog, and the second is on the Effects toolbar. By the way, this is also a good trick to know if you're printing imagery on relatively inexpensive paper and don't want to over-saturate the paper with ink.
The idea is that you should evaluate what will work best for your purposes and use that approach. No single strategy will work best in all cases. If I'm pressed for a quick answer, I usually say use a yellow or white drop shadow on black text. The reason is that it's fast to set up and it will make more text appear legible, while obscuring the least amount of imagery. A potentially better solution is to use annotation, but that requires more time to create, and to create the masks. Also, drawing the transparent masks adds a little to drawing time.
fredag den 4. april 2008
A look at ArcGIS Explorer Build 600
http://www.spatiallyadjusted.com/2008/04/02/look-at-arcgis-explorer-build-600/#comment-33966
For those of you who didn’t get to see Build 600 in person at the Business Partner or Developer Summit this March, the ArcGIS Explorer team has posted a screenshot with the new “ribbon” interface. It does look really nice and the usability is much improved.
10 responses so far ↓
· 1 Dude // Apr 2, 2008 at 6:57 pm
At first I thought the newest releases of ArcExplorer was just a pathetic response to Google Earth and MS Virtual Earth. But now that I’ve spent some time in all three, I’m really thinking that ArcExplorer is the best of all of ‘em! AE rocks when you figure it all out. It is ESRI’s best viewers they’ve ever released, and it’s FREE, of course. Amazing. Probalby can thank Google and Microsoft for providing that incentive to ESRI to make something this good free. AE has good imagery, the navigation controls rock, the 3D viewer is the best (including the ability to exaggerate terrain, fly through it in a better way than most of the others), and The ability to load in our own data, including kmz files (sketchup 3d models!) is over the top. Anyway that’s my take on it. I’m not an ESRI guy, just providing my view on it. Try it out and really dig into it, if you haven’t already. Kudos to ESRI on this one.
· 2 Dude // Apr 2, 2008 at 7:34 pm
Sorry, I meant “ArcGIS Explorer” above, not just plain old ArcExplorer. ArcDude.
· 3 Tim Maddle // Apr 3, 2008 at 5:36 am
Looks great. I think Build 480 is supposed to bring performance improvements, which would definitely be welcome in my case.
· 4 Ron // Apr 3, 2008 at 6:50 am
Thank you Google.
· 5 John Brosowsky // Apr 3, 2008 at 7:28 am
Thank you ESRI. The vision for ArcGIS Explorer is really a great one and its really becoming clear now how ESRI is putting a lot into this. It already does way more than google earth and VE. I for one am really interested in the upcoming explorer stuff talked about at the dev summit:
- explorer embeddable control for developers creating custom desktop apps (google earth does not have that, VE does not have that)
- web control to put 3D mapping in a web application (google maps / earth does not have that)
· 6 Ron // Apr 3, 2008 at 8:18 am
John, if it weren’t for Google can you honestly say that ESRI would have developed this at this time?
· 7 James Fee // Apr 3, 2008 at 8:52 am
Well they did have ArcGlobe. Who is to say they wouldn’t have made a 3D viewer for ArcGIS Server Globe Services? ArcGIS Explorer is about selling ArcGIS Server, not about competing with Google.
· 8 John Brosowsky // Apr 3, 2008 at 8:56 am
I think yes - if there was no such thing as google, ESRI would still today have a great 3D globe app that they would be continually evolving based on new technologies. Remember ESRI’s 3D analyst extension, as well as ArcGlobe came before Google Earth, and ArcExplorer was free before that right? Maybe the keyhole guys were influenced by all of that. Who can say, and who cares? But we can certainly say now that explorer is on a great path and ESRI is doing a really good job at it.
Look, sure there is no doubt that Google earth was sucessful in some compelling and new ways, that has made lots of people think.
But now today, I for one am most interested in an embeddable component, as well as a web component, so that I can develop my own very vertical domain specific apps with the now common “globe feel and experience” but with my own UI and tools.
I can’t do a custom VE app on a stand-alone computer that’s not connected to the web, and I can’t do a google earth app in a web browser. I also can’t drop a GE control onto a windows form and develop my own app . So I welcome those things from ESRI.
I am interested to think about how an embeddable explorer control positions against ArcGIS engine, and now an explorer web control will fit into ArcGIS Server. Since ESRI talked about it at the dev sumit, we are all free to speculate until we get more info from ESRI.
For that matter, I am also interested in ArcGIS Online + the javascript API - which can replace Google Maps, and VE for 2D mashups - but ESRI does not yet know pricing for “non-free” applications of this technology. From what they told us at the dev summit, its free for users inside your enterprise, but not free for apps open to the web - which would be the opposite of say VE. But that’s another topic to shake out, maybe someone knows more than me on that - I would like to hear it if they do.
· 9 bender // Apr 3, 2008 at 1:37 pm
this app is completely useless because ags gets confused with the layer order in its globe services. one layer per service is not valuable.
· 10 Jason // Apr 3, 2008 at 4:45 pm
Looks remarkably like Office 2007. One just hopes it delivers a little more functionality than a word processor.
Starry Night Online
http://www.space.com/snserver/snweb.php?zip=
Starry Night Online: Beta is a fun resource from Imaginova Corp. that lets you explore what stars and constellations can be seen in the night sky at your location by entering your ZIP Code (or your lat/long). You can tinker with date, time, viewing direction, azimuth (compass heading) and elevation above the horizon. You can also look at the sky from the moon, which is a real "out of this world" experience.

Starry Night Online: Beta is a fun resource from Imaginova Corp. that lets you explore what stars and constellations can be seen in the night sky at your location by entering your ZIP Code (or your lat/long). You can tinker with date, time, viewing direction, azimuth (compass heading) and elevation above the horizon. You can also look at the sky from the moon, which is a real "out of this world" experience.

Are multi-layer caches worth it?
http://viswaug.wordpress.com/2008/04/04/are-multi-layer-caches-worth-it/
Are multi-layer caches worth it?
Posted by viswaug on April 4, 2008
The requirements for one our projects had eliminated the use of single fused cache for the web application. I was doing some research into whether using a multi-layer cache would help the performance of the application given the extensive requirements that we are trying to tackle. I was trying to find some broad guidelines to justify using multi-layer caches for our application. One of the helpful guys at ESRI pointed me to this link in the ArcGIS 9.3 documentation page (I couldn’t find it in the 9.2 documentation) that does just that.
http://webhelp.esri.com/arcgisserver/9.3/dotNet/index.htm#choosing_cache_properties.htm (See the “Advanced options (cache type)” section). I think you need to be in the 9.3 Beta program to access the link. If you don’t have access to the link, here is what you need to know.
If you do use a multi-layer cache, ArcMap is the recommended client for working with the cache. Using a multi-layer cache in a Web application provides little or no advantage over using a non-cached map service. The Zoom Level control that appears with fused caches does not appear when you use a multi-layer cache in a Web Mapping Application.
The issue with the zoom level control is supposed to be fixed in 9.3. But the recommendation on using ‘ArcMap’ as the client still should hold true. So, if you are thinking about using multi-layer caches in your application, keep that in the back of your mind. But this does make me wonder as to how many people are actually using multi-layer caches with any kind of success in their web applications…
torsdag den 3. april 2008
ArcGIS Explorer Build 600, A Sneak Peak
http://mandown.co.nz/esri/arcgis-explorer-build-600-a-sneak-peak/
ArcGIS Explorer Build 600, A Sneak Peak
ESRI - Thursday, April 03 2008
I might have mentioned briefly about the new build that was showcased at the ESRI Developer Summit 2008. I see today the ArcGIS Explorer Team has released some further information about this build.
One of the biggest changes coming in build 600 is the redesigned UI. The UI takes advantage of the Microsoft Office 2007 ribbon style. If you have been using Microsoft Office 2007 then you would know how nice and easy this is to use.
So what's coming?
Using the new ribbon user interface will make the functions of the application easier to find and experiment with. The ribbon also makes it possible to display only the functions that are applicable to what you are doing and hides controls that are not relevant. Other key aspects of the new user experience include:
Better map content management Easier access to ArcGIS Online basemaps Improved window management
A nice new feature coming in ArcGIS Explorer Build 600 is the ability to view your map in both 2D as well as 3D. This is pretty cool!
ArcGIS Explorer Build 600 will be coming later this year so stayed tuned! More about the features coming in this build can be found on the write up here: http://blogs.esri.com/info/...
onsdag den 2. april 2008
Improve Software Quality Automatically
http://www.coverity.com/
Improve Software Quality Automatically
Coverity's static source code analysis solutions automatically enable better software quality by providing development teams with tools to systematically measure, analyze, and improve both the inputs to the software production process and the results produced. As software systems evolve over time, Coverity helps production teams easily understand and manage changes made to the source code and system architecture.
tirsdag den 1. april 2008
When Marketing Hype Meets Reality: ArcGIS Server
http://blog.davebouwman.net/2008/04/01/WhenMarketingHypeMeetsRealityArcGISServer.aspx
When Marketing Hype Meets Reality: ArcGIS Server
Posted on 31. marts 2008 21:54:11 (Mountain Daylight Time, UTC-06:00)
Comments [2]
Categories:
One issue I seem to run into a lot is the gap between client expectations of ArcGIS Server, and the reality. Although I did bring this up at the closing session of the Developer Summit, and we were told this would be addressed, I think it's worth pointing out some specifics.
On the one hand we read "Fulfilling the Promise of Complete Enterprise GIS" in the Fall 2007 ArcNews issue. Some quotes...
... to support fast and efficient visualization and analytics applications, regardless of the amount of data held within an organization.
Any model or tool authored in ArcGIS Desktop can be shared to a broad audience via ArcGIS Server...
It's typical of much of the marketing. Pushing the simple author-publish-consume model, in which Joe GIS can just take his map, and geoprocessing models and fire it up onto the web in a few short clicks. To be sure this makes a great marketing story... "Wow - I can do that! Lets buy ArcGIS Server!"
But what happens when reality steps in? When Joe GIS takes his map, and geoprocessing service and publishes it?
Typically the site is slow, the geoprocessing tasks randomly fail and take ages when they succeed, and the Joe GIS gets (understandably) negative feedback from his users and superiors. So he packs up his bags and heads out to the developer summit, with one agenda: make his site faster. He drops into the "Architecting ArcGIS Server Solutions for Performance and Scalability Session". On slide 5th slide, the first golden nugget of truth is revealed:
The item in question is somewhat small on this slide, and it's not spelled out directly, so let me help out - "Design your maps specifically for server deployment".
Somehow this never makes it into the ArcNews articles or the demos. Nor do the items on the following few slides...
only use the ESRI Optimized symbology,
use annotation instead of labels,
skip the fancy cartography - including highway symbols
cache everything you can,
and only load a few layers.
So Joe GIS now realizes he's going to have to re-work all his maps. But there's got to be some good news about the geoprocessing right?
Enter golden nugget of truth two - and nope. Seems Joe is going to have to do a bunch of pre-processing, and stage up his data differently. So much for just publishing the data as it is. What does this "Understand Performance Expectations" mean? Oh yeah - basically if it's slow in desktop, it will be slow in server. And this last bit about only one instance can update data at a time? That does not sound too good. And Joe's ESRI reps have been telling him to use geoprocessing to do everything, but if he uses Geoprocessing his site can't handle all 5 of his users at once! Maybe it's time to take a look at .NET and that ADF thing...
I could go on through the entire presentation, and point out the various inconsistencies between what we see in the ArcGIS Server marketing and the reality (aside: check out slide 28 where they tell you to disable seamless panning and drop the overview map - how many demos have you seen where seamless panning is disabled?!)
What's really interesting is this is ESRI telling you both things! Right hand meet left hand. Marketing meet the technical staff. Take each other out for lunch. Talk. Listen. Learn. ArcGIS Server is a great product - it can do lots of great things, but it's not a point and shoot camera. It's a serious SLR, that needs professional skill to operate effectively and efficiently.
Until the large scale marketing shift happens, here are a few suggestions for the ESRI technical marketing people out talking to clients:
Be up front about what ArcGIS server can do, and what it can't.
Be up front about having to specifically author maps for server, and the limitations on cartography, number of layers and caching.
Be up front about having to pre-process data used in geoprocessing tasks, and concurrency limitations.
Be up-front about the fact that to do much beyond pan and zoom, there will be some coding needed, and the water gets deep fast.
Be up front about the server loads and the licensing costs to scale out.
Then show some totally kick-ass demos. Show something truly amazing, and be rock stars about it, but just don't lip synch. Be up front about the reality of running ArcGIS Server, because every single one of your users are going to experience this reality. Set customer expectations realistically, and everyone wins.
Link to the presentation listed above
Abonner på:
Kommentarer (Atom)