lørdag den 28. februar 2009

AGI Visualizes Geo-Physics on Virtual Earth


Super cool ... se også videoerne ...
/Sik


Super coole ... see also the videos ...
/Sik


Quote

I may have to quit my job. I want to go out on top like John Elway. Once I’ve seen everything, I don’t know what else will light a fire under me to get up in the morning. Analytical Graphics, Inc. (AGI) has just changed my world by demonstrating how Microsoft Virtual Earth can be used to visualize data like I’ve never seen before. Read the official press release on the AGI web site - AGI Software Incorporates Microsoft Virtual Earth Platform. AGI offers a physics-based software geometry engine that accurately displays and analyzes dynamic objects in real or simulated time. AGI integrated Virtual Earth into their software by (a) incorporating core analysis into the Virtual Earth platform and (b) integrating Microsoft Virtual Earth imagery in to their 3D software products. [...]

image

image


Read more: http://blogs.msdn.com/virtualearth/archive/2009/02/27/agi-visualizes-geo-physics-on-virtual-earth.aspx

Satellites show the way to new oil finds


Hvor meget olie findes der egentlig og hvor meget fylder det? Hvis al den olie man har brændt af tælles med hvor stor et oliehav taler vi så om? Med det konstante forbrug der har været og stadig er så må der være tale om kolosale mængder, men hvor store? Snakker vi om samme størrelse som f.eks. Sortehavet?
/Sik


How much oil is there and how big a volume is it equivalent to? If all the oil we have already burned of is used in this calculation how big is the ocean of oil in question? Given the huge constant amount of oil being used we are talking gigantic volumes but how big? Is the size equevalent to say the Black Sea?
/Sik


Quote

A new map of the Earth’s gravitational force based on satellite measurements makes it much less resource intensive to find new oil deposits. The map will be particularly useful as the ice melts in the oil-rich Arctic regions. Ole Baltazar, senior scientist at the National Space Institute, Technical University of Denmark (DTU Space), headed the development of the map.

The US company Fugro, one of the world’s leading oil exploration companies, is one of the companies that have already made use of the gravitational map. The company has now initiated a research partnership with DTU Space.

Ole Baltazar’s map shows variations in gravitational force across the surface of the Earth and knowledge about these small variations is a valuable tool in oil exploration. Subterranean oil deposits are encapsulated in relatively light materials such as limestone and clay and because these materials are light, they have less gravitational force than the surrounding materials.

Ole Baltazar’s map is based on satellite measurements and has a hitherto unseen level of detail and accuracy. With this map in your hands, it is, therefore, easier to find new deposits of oil underground.

The gravitational map from DTU Space is unique on account of its resolution of only 2 km and the fact that it covers both land and sea regions. Oil companies use the map in the first phases of oil exploration. Previously, interesting areas were typically selected using protracted, expensive measurements from planes or ships. The interesting areas appear clearly on the map and the companies can, therefore, plan their exploration much more efficiently.

The success of the gravitational map is due in large part to the fact that it is not based on direct gravitation measurements but on observations of the height of the sea, which reflects the gravitation.

Provided by Technical University of Denmark


Read more: http://www.educationgis.com/2009/02/satellites-show-way-to-new-oil-finds.html

Virtual Earth Web Casts


FYI
/Sik


FYI
/Sik


Quote

Virtual Earth Webcasts

Tighter budgets mean that businesses need strong customer connections to build loyalty, boost their businesses, and grow profits. Companies also need to visualize areas of growth and opportunity, as well as branches or divisions that may need special attention.


Attend Our Informative Webcasts
March Series: 
Boost your hospitality brand and better connect with your customers
  • Hospitality Organizations Create Strong Guest Connections
    with Virtual Earth

    Find out how Virtual Earth can help your hospitality organization connect with customers and build loyalty, gain deep business insight, and boost your profits. Build your brand, drive customers from the Web to your locations, and gain important business insight.

    Join Virtual Earth technical evangelist Chris Pendleton, and Tyler Davey from Infusion, a Microsoft Gold Certified Partner, at 10 a.m. Pacific Standard Time, on Wednesday, March 25.

    Sign up today


On-Demand Webcasts

Read more: http://www.microsoft.com/virtualearth/webcasts/learnmore.aspx

Google Maps sliding mashup sample


Jeg havde den fornøjelse at holde et indlæg ved et GeoMidt arrangement i torsdags hvor også Lars fra Geodata Danmark fortalte om hans og GDKs erfaringer med Google Map. Et af de eksempler han viste var dette hvor han lægger et ortofoto ind over Google Maps ortofoto og vha en slider gør det muligt at toggle imellem de to ortofotos. Ret smart og en effektiv måde visuelt at vise forskelle imellem forskellige datasæt.

Slider ideen havde han fået fra KMS som bruger den til at vise historiske kort på samme måde:


Lars har indsendt løsningen til ESRI code challenge - så held og lykke med den ...
/Sik


Mostly Danish. Using a slider to present the same map extent using two versions of the same data set is an effective way when visually identifying differences in data ... 
/Sik


Quote


Read more: http://tilly.geodata.dk/CodeChallenge/SlideMashup/SlideMashup.htm

ArcGIS 9.3 JavaScript API 1.3 Now Available


FYI
/Sik


FYI
/Sik


Quote

ArcGIS 9.3 JavaScript API 1.2 was released late year. Since then the team has been hard at work on the next version. ArcGIS 9.3 JavaScript API 1.3 is now available for immediate use.

There are a bundle of new features. Some of these include:

  • Support for Dojo 1.2.3
  • Layer Extensibility
  • Error Handling
  • Enhanced Map Layer Management
  • Other Map Enhancements
  • I/O Enhancements
  • Other Enhancements
  • Bug Fixes

A full write up of all the new features can be found on the ESRI Resource Centre for the ArcGIS 9.3 JavaScript API here: http://resources.esri.com/help/...

The SDK examples have already been updated to use the new ArcGIS 9.3 JavaScript API 1.3.


Read more: http://mandown.co.nz/development/arcgis-9-3-javascript-api-1-3-now-available/

A Maintenance Release for Google SketchUp 7


Nu kan du bygge dit eget 'rigtige' Atlantis ...
/Sik


Now, you can build your own 'real' Atlantis ...
/Sik


Quote

As you may recall, we launched Google SketchUp 7 last November. Today I'm happy to announce our first maintenance release for version 7 with fixes to many of the most commonly reported problems. The list of fixes in our release notes is pretty long, so I asked Tommy from our Support team what he thought would be good to highlight. Here's what he had to say: 

  • Place models underwater in Google Earth: Google Earth 5.0 launched earlier this month and added ocean floor terrain, which made it possible to place models under the water. But SketchUp didn't have a way to support that...until now. Those of you working on secret plans for underwater hideouts (laser sharks) can now place those models in Google Earth.
  • More accurate model placement in Google Earth: Models placed from SketchUp into Google Earth sometimes came in with rotational errors, making it difficult to properly position a model. Likewise, edges that weren't part of a face were being dropped, which made kites, bridge cables, and some windmills look a little odd. We've fixed both of these issues.
  • Authorizing Pro is easier: On Windows Vista®, SketchUp Pro folks had to run as an "Administrator" to authorize. You don't have to do that any more.


Read more: http://sketchupdate.blogspot.com/2009/02/maintenance-release-for-google-sketchup.html

fredag den 27. februar 2009

Online KML To Shapefile Converter


FYI
/Sik


FYI
/Sik


Quote

 Zonums Software  has released an online KML to shapefile converter:

Online KML to shapefile converter

Select the KML/KMZ file you want to convert, or paste the KML text into the box at the bottom. In this case, I’ve uploaded a KML file with 3 points, one path and one polygon, and the KML code appears in the text box: [...]

Hudson Plane Crash in Google Earth


Lyder spændende men GE vil bare ikke starte på min kværn her til aften ...
/Sik


Sounds like a lot of horrer but I can't however see it tonight because GE has decided not to work on my laptop right now ...
/Sik


Quote

I'm not often one to be overawed by content in Google Earth but if you watch one thing today, have a look at this: Its a tour following flight 1549

as it crash landed in the Hudson River and is really something special. Its by Jeral Poskey via Google Earth Blog, make sure you turn on 3D buildings layer to watch it.

The voices of all the flight controllers are added in real time. As Frank notes, the coolness of the pilot is amazing. Also you can hear the flight controllers talking really quickly about all the normal things they say like runways and altitudes - obviously they can talk at this speed because they and the pilots are used to hearing the set phrases. When the pilot reports the bird strike you can hear the controller's speech slow right down, obviously because this is not what he normally gets to say. You can just imagine the adrenaline pumping. [...]


Read more: http://googleearthdesign.blogspot.com/2009/02/hudson-plane-crash-in-google-earth.html

Innovativ udnyttelse af offentlige data


Afsindig spændende læsning ... Set fra et produktudviklingssynspunkt er der et kæmpepotentiale i at give/få adgang til de gigantiske mængder af data som er produceret og vedligeholdt herhjemme. Set fra et GIS synspunkt flimrer det allerede for øjnene ved tanken om alle de lækre kort og applikationer der vil kunne fremstilles. Men så er der tankerne omkring den forretningsmodel som skal bære data ud til folket - Videnskabsministeren har lagt op til at en pris på data skal/vil animere til øget udbud af nye tjenester og endnu mere omsætning. Et eller andet sted klinger det ikke helt rigtigt ... brug af data skal koste og hvem skal betale? Det skal slutbrugerne - os allesammen. Først betaler vi for at data skabt, så betaler vi for at få data udstillet og i sidste ende skal vi også betale for at bruge data ... Fair? Måske og måske ikke ... jeg tror man har brug for at se nogen af de første gode ideer udviklet på denne data-platform ...
/Sik


Only Danish.
/Sik


Quote

Den offentlige sektor har siden sit udspring indsamlet og behandlet data i forbindelse med sit virke. Den teknologiske og samfundsmæssige udvikling har i en gensidig påvirkning udviklet det offentliges anvendelse af data og fremkomsten af IT har betydet en eksplosion i produktionen af data i det offentlige. Gradvist har modeller for integration af IT-systemer bevirket, at det har vist sig fordelagtigt at genbruge data på tværs i det offentlige som det sker i vidt omfang i forbindelse med etablering af stamdataregistrene (CPR, CVR, etc.),
geografiske data og statistiske data. 

Fremkomsten af modeller og infrastruktur til integration af IT-systemer har desuden bevirket, at man i Danmark og internationalt har set modeller for genanvendelse af offentlige data i den private sektor. Det vil sige, at f.eks. CPR-data anvendes til at sikre at bankerne bliver opmærksomme på bl.a. flytninger og dødsfald. Denne genanvendelse af data skaber værdi både i form af udvikling og salg af produkter og services (ved bl.a. at indbygge CPR-data i f.eks. kundehåndteringssystemer) og gennem effektivisering af processer internt i f.eks.
banker.

Det er Gartners vurdering at man i Danmark er forholdsvis langt med genanvendelse af offentlige data, når man sammenligner med genanvendelsen i andre lande. Det skyldes bl.a. en lang tradition for at registrere mange data i det offentlige og at man de sidste 20 år er nået relativt langt med digitalisering af den offentlige sektor. Sammenlignet med den totale mængde offentlige data, som findes er graden af genanvendelse af dataene i den private sektor dog stadig meget begrænset i forhold til potentialet.

[...] 

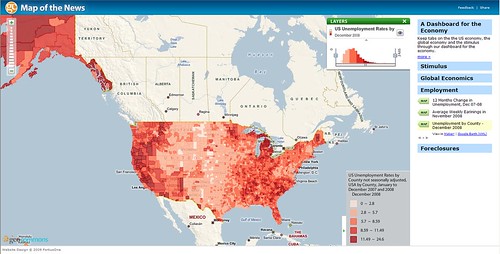
En række teknologiske muligheder baseret på Internettet og web-teknologier er under udvikling, som har givet og vil give muligheder for en række innovative koblinger af data. De mest kendte eksempler på nuværende tidspunkt er såkaldte mashups, som anvender Google Maps eller andre tilsvarende korttjenester som kombineres med andre data til udvikling af nye services. Tjenesten findvej.dk udgør et simpelt eksempel på en sådan mashup i dansk sammenhæng, hvor offentlige adressedata kombineres med Google Maps. Det er Gartners vurdering, at disse mashups kun udgør et hjørne af det potentiale som eksisterer ved at sammenstille og behandle offentlige og private data. Bl.a. mashupmodellen men også mere bredt SOA og WOA modeller giver mulighed for at udnytte potentialer, som ikke tidligere har været mulige, fordi den nødvendige investering har været
for høj.
[...]

Read more: http://digitaliser.dk/resource/237763/artefact/Gartner-innovativ-udnyttelse-v1.1.pdf/inline

Vector Magic - Raster to Vector - update


Ligner et uundværligt værktøj ... Man skal ikke undervurdere hvordan og hvilke map markers man vælger til sine kort ...
/Sik


Looks like a nifty cool tool ... One must not underestimate the importance of map markers - make them look good ...
/Sik


Quote

Vector Magic takes a raster image and recreates it in a vector format.


Basic mode pages: Load ImageWizard ModeImage Type SelectionTransparencyInput QualityColor ModePalette SelectionReview ResultExport Result, and Help

Advanced mode pages: Load ImageWizard ModeTransparencyPalette SelectionImage SegmentationEdit SegmentationPath SmoothingExport Result, and Help

The application has a wizard interface with each page focused on one step of the vectorization process. The screen shots show each of these steps.

Download Free Trial

Download_arrowDownload
     
Windows, v1.11, 9.8 MB, February 26th 
Macintosh, v1.14, 28.1 MB, February 26th

Languages: EnglishDeutsch,
EspañolFrançais, and Italiano

Purchase

Buy Now

Get the power of Vector Magic on your desktop!

1 license = 1 user on 2 computers. 
Same license for both PC and Mac.

Pricing


Read more: 

A map of three summers in the Bay Area


Smukt og kreativt ...
/Sik


Beautifully creative ...
/Sik


Quote

Here’s a book I made recently for my book arts class. I’ll talk about my other classes at some point too.

the cover of my map book

This is a tetra-tetra flexagon that folds open three times to zoom in from California to the Bay Area to San Francisco to the Mission/Castro area. A flexagon sounds fancy but it’s just one piece of paper cut and folded in a certain way — here aredirections for making your own (it’s easy, but it helped me to see them in person first). [...]

reading the book


Read more: http://jeweledplatypus.org/cgi-bin/blosxom.cgi/text/summermapbook.html

Subscribe to ESRI Publications


Hold dig ESRI informeret ...
/Sik


Stay ESRI informed ..
/Sik


Quote

Featured Publications

 ESRI News Feed: Get all the latest news from ESRI. 
RSS Reader  •   Daily  ESRI News Feed

 My ESRI News: Event and product news pertinent to your region and industry. 
Electronic  •   Periodically

ArcNews: GIS news magazine. 
Print  •   Quarterly  ArcNews 
Print—Receive ArcNews quarterly via postal mail. 
Online—Receive a quarterly e-mail containing a link to the latest ArcNews edition online.

 ArcUser: The magazine for ESRI software users. 
Print  •   Quarterly  ArcUser

 ArcWatch: GIS news, views and insights. 
Electronic  •   Monthly  ArcWatch

torsdag den 26. februar 2009

Azure: One big, happy platform?


FYI
/Sik


FYI
/Sik


Quote

Posted by Mary Jo Foley

One platform, under Oz

While this series has focused to this point on Red Dog — the operating system component — of Microsoft’s Azure platform, Azure also includes software and services that aren’t part of the core OS.

In fact, attendees of Microsoft’s Professional Developers Conference held in October 2008 might remember this diagram:

One big, happy cloud platform. Right? [...]


Read more: http://blogs.zdnet.com/microsoft/?p=2173

Explore more with User Photos in Street View


Almindelige brugere er nu del af Googles økosystem ...
/Sik


Ordinary users are now  part of the Googl ecosystem. ...
/Sik


Quote

Starting today, a new feature lets you browse popular user-contributed photos from Panoramio at major landmarks around the world. The many people who virtually visit Paris to see the famous Eiffel Tower or the Notre Dame cathedral in Street View can now also browse the wide array of user photos taken in the vicinity. Just look for photo thumbnails at the top right of the Street View image, and click to view. You can also connect directly to the community behind this great photo content - a link to the author's Panoramio page is shown with every user photo.
The feature is available in many other places too: New YorkSan FranciscoRomeTokyoBarcelonaSydney and New Zealand, to name just a few. Anywhere, really, where Street View is available and where users have contributed lots of high-quality photos; of course, this usually is near famous landmarks but you never know where you'll discover more to see. With user-contributed photos you can inspect architectural details and close-up quirks, or see what is happening at a place at more than one time of day, or see whatever else it was that inspired the photographer to press the button. Take a look at this video to see more: 

If you are a Panoramio user, you may already have a photo in Street View. If not, what are you waiting for? Just contribute your best photos to Panoramio and remember to geo-tag them. Google's image-matching algorithms will analyze them at some point to see if they are also a good match for a Street View location. At the most famous places in the world, competition for space is already tough -- take a look at the range of images of the Sagrada Familia -- but on less travelled roads the world is still largely a blank canvas. Please help to fill it in!


Read more: http://google-latlong.blogspot.com/2009/02/explore-more-with-user-photos-in-street.html

Introducing the ObamaMeter: A Dashboard for the Economy


Hvor lang er en Obama meter ?
/Sik


How long is an Obama meter ?
/Sik


Quote

For a while we’ve been posting maps and data about breaking news stories on the blog. Often times the amount of data needed to convey the geographic perspective of a news story is more than one map or blog post can sustain. A second issue is that some news stories are persistent for an extended period of time, and maps/data need to be updated through real time feeds or just the latest quarters results.

We saw the same problem with commercial customers we work with. One map or analysis did not get the job done. They needed a collection of maps providing status on a range of indicators critical to conducting business. We decided to fuse the two concepts together into a dashboard. In this case of the demo, answering the question, “if I was the president what economic indicators would I want to see to better manage the country“. You can check out our “Dashboard for the Economy” here.

obama_dashboard


Read more: http://blog.fortiusone.com/2009/02/26/introducing-the-obamameter-a-dashboard-for-the-economy/

Building Rich Internet Applications with ArcGIS API for Flex


Vær Flexibel ...
/Sik


Be Flex-able ...
/Sik


Quote

60 minutes Training Seminar Streaming Media

Web developers can now create powerful and engaging GIS Web applications using the ArcGIS API for Flex. This free API hosted by ESRI allows you to leverage the GIS capabilities of ArcGIS Server services with the rich user experience capabilities of the Adobe Flex framework.

This seminar provides an overview of the tools and concepts needed to create your first Web mapping application using the ArcGIS API for Flex. The presenter introduces the concepts of Rich Internet Applications and capabilities of the Adobe Flex framework, and shows how to quickly create a rich Web mapping application using the ArcGIS API for Flex and free sample services available on the ESRI Resource Center.

The seminar also shows how to use existing Flex components with the ArcGIS API for Flex, presents considerations for authoring and deploying applications in a Web server, and points you to additional resources for building Web applications using the ArcGIS API for Flex.

This seminar was developed to support the following software products:

ArcGIS ServerVersion
ArcGIS Server Standard Edition9.3 or 9.3.1
ArcGIS Server Advanced Edition9.3 or 9.3.1

Read more: http://training.esri.com/acb2000/showdetl.cfm?&DID=6&Product_id=940