
Jeg savner at kunne mashe RIA elementer i browseren og ikke være låst fast på én RIA platform og én RIA applikation ...
/Sik

I miss being able to mash RIS elements in the browser and not being tied to ONE RIA platform and ONE RIA application ...
/Sik
Quote
By Adena Schutzberg
[...]
RIA Frameworks
RIAs are enabled by RIA frameworks, software installed on the client computer. The frameworks manage downloads and updates, and run the RIAs. In the best case scenario, the frameworks are invisible to the user.
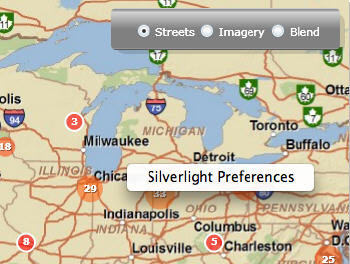
There are many RIA frameworks (and some arguments about which technologies are, or are not, RIA frameworks), but the most widely known in the geospatial arena are probably AJAX, Adobe Flash/Flex and Microsoft Silverlight. Soon, we are likely to hear more about Google Gears. [...]
What's a Rich Internet Application, Anyway?
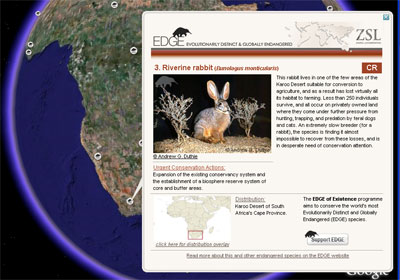
Rich Internet Application (RIA) is a phrase that distinguishes the more elegant Web apps from the less elegant ones. Different publications list different "properties" for RIAs. This list is from Java Today.
The app:
- is launched from (or even contained within) a Web page
- provides immediate feedback to users, with no refresh required
- supports tree controls, tabbed panels, drag and drop, and keyboard navigation usually found in desktop packages
- used platform independent coding
RIA Frameworks
RIAs are enabled by RIA frameworks, software installed on the client computer. The frameworks manage downloads and updates, and run the RIAs. In the best case scenario, the frameworks are invisible to the user.
There are many RIA frameworks (and some arguments about which technologies are, or are not, RIA frameworks), but the most widely known in the geospatial arena are probably AJAX, Adobe Flash/Flex and Microsoft Silverlight. Soon, we are likely to hear more about Google Gears. [...]
 |


