Et meget undervurderet værktøj ...
/Sik

A tool not so well known as it deserves to be ...
/Sik
Quote
[...]
Well, Google recently announced some exciting new additions to the API. According to the announcement you can now upload and map large amounts of geographic data. This used to require a developer, but now you can do it yourself. You can also now hide and show different data depending on your own criteria.
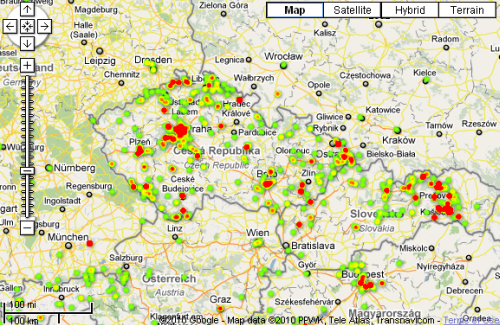
The folks at MTBGuru.com detailed their use of the new capabilities in a blog post. Some of the screen shots from their application can be seen below. The data driving their application is stored in a Fusion Table. I’m particularly impressed with the capability of creating heat maps as seen in the second figure.
Here the heat map shows the density of bike tracks in a certain area.
Google is continuing to push the envelope in the mapping and visualization space. Fusion Tables isn’t getting the press is deserves at this time, but I think that is going to change rapidly as people get a better understanding of how it can be used. [...]
Read more: http://geochalkboard.wordpress.com/2010/03/03/heat-mapping-with-google-fusion-tables/


Ingen kommentarer:
Send en kommentar