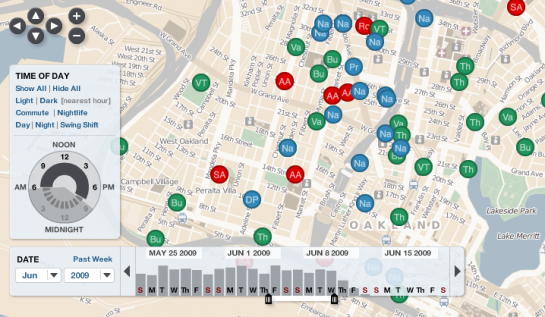
Mange indbrud sker i nærheden af et busstoppested ... Indbrudstyve er enten dovne eller også er de meget miljøbevidste ...
/Sik

A report in Denmark showed a higher number of burglaries near bus stops ... Burglars are either lazy or quite enviromentally aware ...
/Sik
Quote
POSTED BY NATHAN
There's a lot of crime data. For almost every reported crime, there's a paper or digital record of it somewhere, which means hundreds of thousands of data points - number of thefts, break-ins, assaults, and homicides as well as where and when the incidents occurred.
With all this data it's no surprise that the NYPD (and more recently, the LAPD) took a liking to COMPSTAT, an accountability management system driven by data.
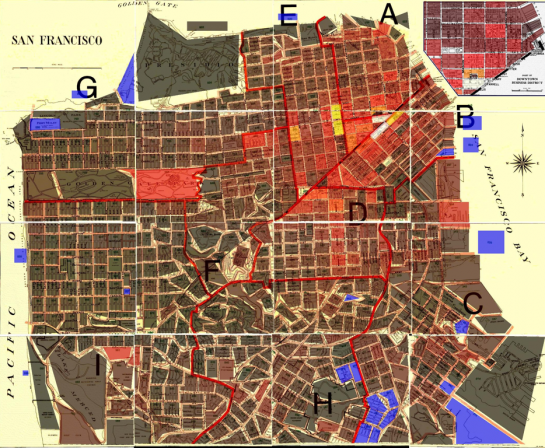
While a lot of this crime data is kept confidential to respect people's privacy, there's still plenty of publicly available records. Here we take a look at twenty visualization examples that explore this data.


Source: Flowing Data
Read more: http://flowingdata.com/2009/06/23/20-visualizations-to-understand-crime/
Ingen kommentarer:
Send en kommentar